


As declared in Forbes, businesses are starting to really wake up to the promise of what we call Enterprise AI. But what does that mean for the average non-coding analyst?
.png?width=805&name=7%20things%20you%20can%20do%20without%20coding%20infographic-2021%20(1).png)
Well, exponentially growing the insights gained from data is critical for the movement into Enterprise AI, and it’s a matter of scale — using more available data for more data projects, faster. This cannot happen without expanding the breadth of people that have access to and work with data on a day-to-day basis (read: this cannot happen without you, the non-coding analyst, taking on a bigger role).

Yet, incorporating the work of non-data scientists into data projects in meaningful ways requires a fundamental shift in mindset around data tooling, namely the addition of powerful features that allow data analysts to do impactful work without coding. And we’re not talking about spreadsheets, which cap out quickly on big data projects.
Dataiku does provide these powerful features — through the visual analysis layer, data analysts can easily explore, prepare, enrich, and visualize various types of structured and unstructured data (pssst, by the way — it’s way more useful, not to mention less frustrating, than spreadsheets). And with data scientists working in Dataiku as well — through coding or whatever tools they like best — collaboration on data projects is seamless.
Here are just seven of the top code-free features Dataiku has to offer that will change the way you work with data.
1. Smart Data Ingestion
Contact IT, request access to data, wait days (or weeks), get access, rinse, repeat. Sound familiar? Dataiku has a better way — upload datasets to work with XLSX or CSV files or connect to other sources (databases, server-hosted files, connections to business applications, etc.).
And Dataiku is smart — for instance, when you upload a CSV or Excel file, it automatically recognises separators and character encoding (utf-8 headaches, anyone?). Plus, it will display a preview of the dataset for you to check if everything is in order, including the number of lines, and let you change some parameters (like skipping lines, handling column headers, etc.) to make sure that the data is consistent immediately upon upload.
Other useful code-free smart data ingestion features include the ability to:
- Combine data of all sizes, shapes, and locations without running into that million row restriction
-
Automatically stack identical files into one dataset by drag-and-dropping them into the interface
-
Merge spreadsheet tabs into one dataset
-
Rename columns and set data types directly in the schema panel so that certain columns are always stored in specific formats
2. Working with Dates and Times
Time-based features are commonplace in data-driven use cases, and they can be a real pain to work with. Depending on the original format, you might have to do some heavy recoding in order to parse the dates into a recognized date feature.
In Dataiku, the smart date processor will recognize probable date formats and suggest different parsing options, showing you how well each option performs.
In just a few clicks, Dataiku also allows you to enrich data and create time-based features, including:
-
Extracting date components (month, hour, day of week, week of year, etc.)
-
Calculating differences between date columns
-
Flagging national holidays
-
...and more!
3. Cleaning complex text fields
When you have really messy text fields, aside from using complex regular expressions, cleaning and structuring that data is a nightmare. But Dataiku has code-free text cleaning processors (like split, find and replace, truncate, etc.) that make this possible in minutes.
Here is data scraped from a JavaScript map on the web indicating the name and location of garages:
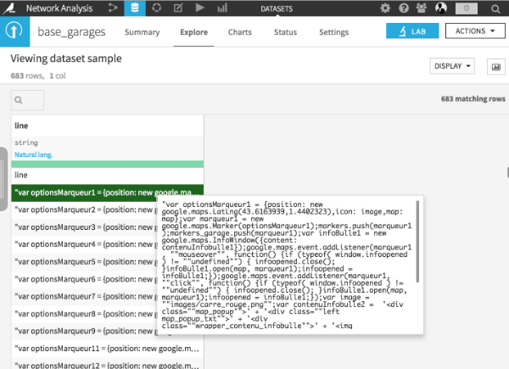
Some really messy text fields - yikes!
And here, after just a few clicks, is that same data extracted with columns containing desired information:
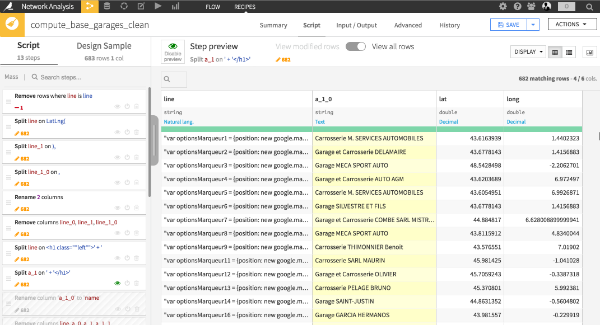
Those same fields, nicely extracted thanks to code-free text cleaning in Dataiku!
4. Streaming Twitter Data
Dataiku has a simple connector that can retrieve Tweets or related information (user handle, location, hashtags, etc.) based on keywords or hashtags. Once the data is captured, visual text analysis features can cluster similar Tweets, split them into words or n-grams, simplify and remove stop words, and more — all of this is a good first step towards doing sentiment analysis, and all without a single line of code.
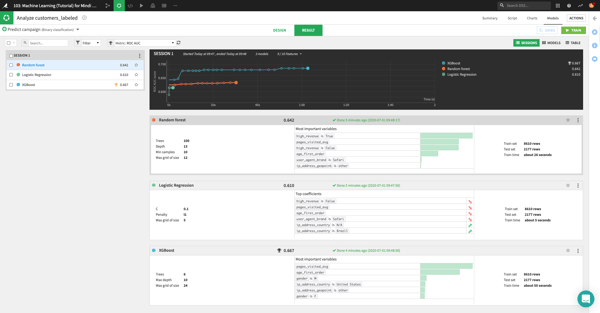
5. Creating machine learning models
Who said you needed to be a data scientist to use machine learning techniques? Dataiku allows non-coders to train algorithms, start making predictions, identify clusters, and extract useful information about features without writing a single line of code.
Learn more about visual machine learning in Dataiku here.
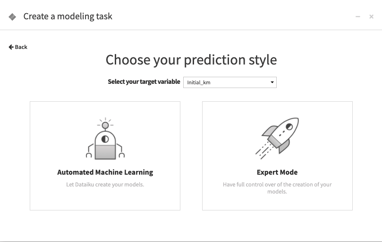
Visual machine learning in Dataiku
6. Combining / Joining datasets
Quite often, enriching data can be done through joining datasets — essentially, retrieving columns from one dataset or tab into a reference dataset (VLOOKUP). This is a key element of any analysis, but it can quickly become a nightmare when you have several sources (both in terms of computation time and joining criterion).
In Dataiku, blending data sources is simplified (and all visual, no VLOOKUPs required) with specific processors that can easily retrieve all data from other datasets or join based on specific, fine-tuned keys and criteria.
7. Working with Geographical Data
Geospatial analysis is critical for a number of use cases.
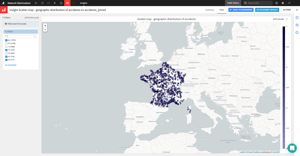
For example, optimizing a network of rental agencies, mapping competition, sizing a target market, and more. Dataiku features a few processors that facilitate working with locations, most notably;
-
Retrieving a latitude and longitude from an address with the OpenStreetMap or Bing Maps API
-
Enriching a latitude and longitude with administrative information (like city, state, department, etc.)
The Dataiku chart engine also packages the ability to draw scatter maps and heat maps with various levels of aggregation (see chart at right).
So there you have it, seven awesome things you can do in Dataiku without a single line of code. But there are many, many more! Check out the guidebook to go from Excel to Dataiku or download the free version of Dataiku to discover them for yourself!