


Almost every action we do on the Internet or on mobile applications is recorded in files known as web logs. These logs can be massive, providing a classic example of Big Data.

NOTE: This blog post was updated in 2020, but this event took place in 2016. You can check out a much more up-to-date version of Dataiku in action here.

Data science and machine learning algorithms can provide a way of extracting value from web logs. At the OVH Summit in October, I presented a workshop on getting value out of web logs through machine learning with Dataiku. In this article, I will run through the aspects of that presentation.
What Are Web Logs?
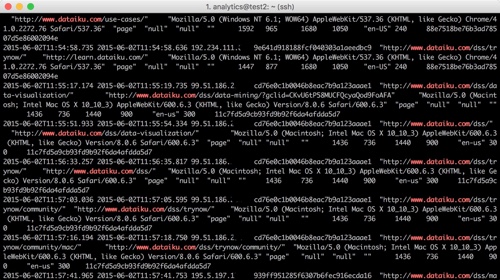
In web logs, as shown in the picture below, each line (or record) represents a user’s action (e.g. opening a page, an error that occurs, or something else) typically with the following information:
- Date and time of the action
- User’s IP address
- Details of the action
- Diverse information on the context (user-agent, etc.)
 From this fairly raw data, which is often stored in flat compressed files, the aim is not to calculate a descriptive statistic, such as the number of visitors per country or the conversion rate. If this is the goal, Google Analytics or Matomo are very good tools.
Instead, the objective is to resolve advanced problems that are specific to the business context of the company. Data science allows us to produce use cases such as client segmentation or product recommendation. I will recap on some of these at the end of the article.
Data Prep
The obvious first step in a web log project is data preparation. For example:
- Filter and retain certain actions.
- Identify (or split) dates and make use of them (differences between two dates etc.).
- Clean missing or abnormal data.
- Geographically locate the IP address.
- Work with certain values such as the user agent of a navigator.
- Categorize certain actions (from the URL, for example).
It is possible to do most of these actions visually, that is to say without using code, in Dataiku. For example, here we split dates and geographically locate the IP address:
Throughout the data preparation process, I can use graphics and descriptive statistics in order to understand the variables being manipulated.
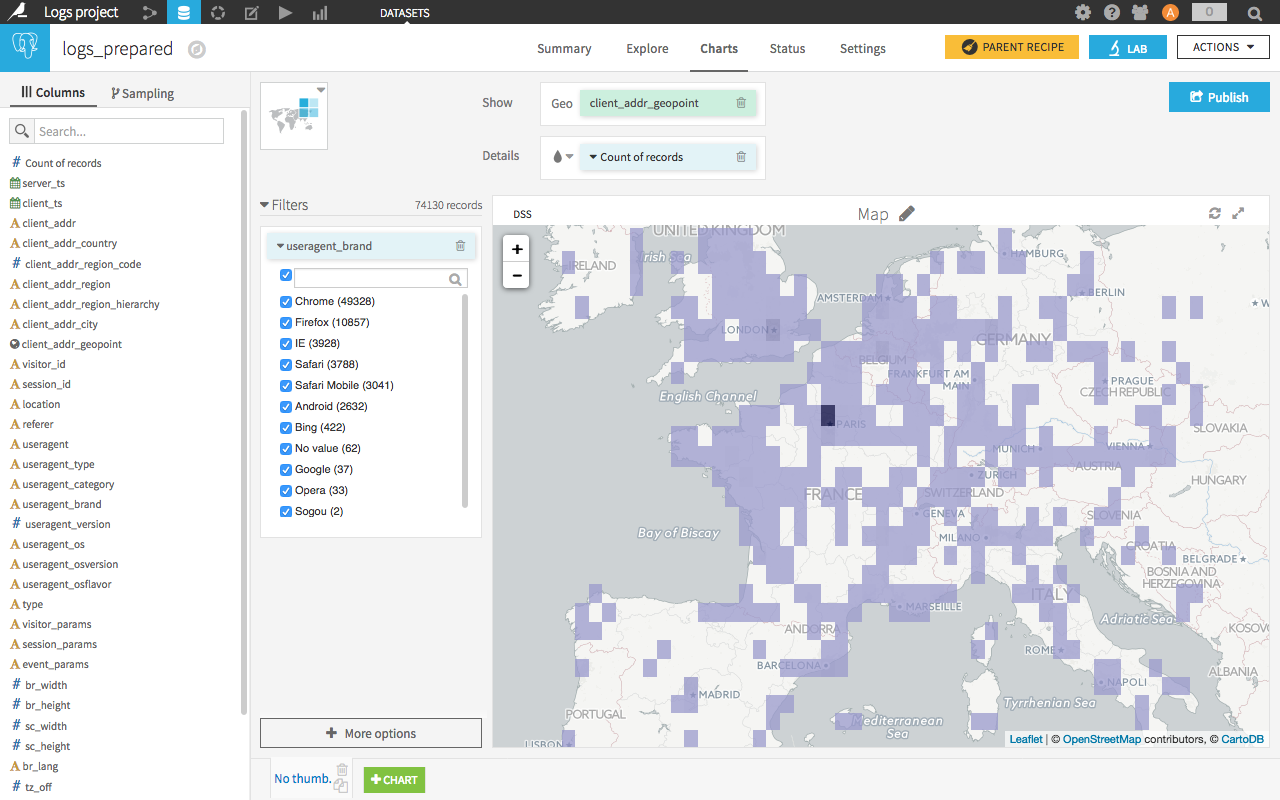
Example of a map built from IP geolocation.
Grouping Data
The second stage is the reduction of dimension. The idea is to pass from the action level to the user level with a summary of the user’s actions. In effect, in order to apply a machine learning algorithm, we need each line to represent one user (I speak here for the majority of cases).
To do this, I will use the visual process ‘group by’ to group lines and construct the “summary” of the user. To construct variables which will qualify the users, use visual tools or SQL code.
A few examples of variables obtained for each user:
- Number of actions
- Dates of the first and last actions
- Counts of occurrences of some actions (more advanced: count of occurrences through a sliding time window)
- Statistical indicators of actions or their associated values (means, quartiles, deviations, etc.)
Note that these transformations can be executed in database using a SQL base, a Hadoop cluster, or a Spark cluster (via Hive or Impala).
These variables are very important, as they allow me to “feed” the algorithm with user characteristics and behaviors. Of course, adding external information to web logs brings many advantages, as is the case for CRM data. Technically, this can be a simple left join on the client user name using a CRM table to combine the data with the inscription date, the number of sales, or information about the client profile.
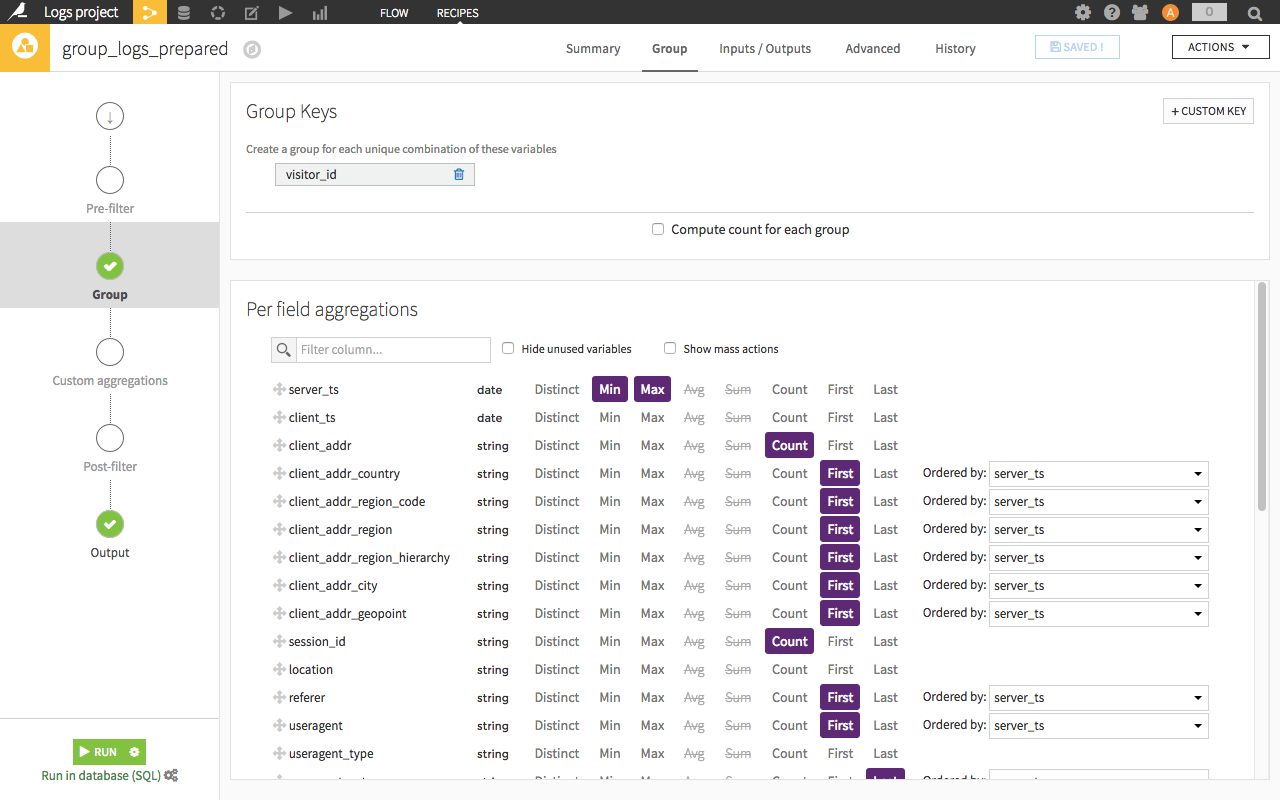
Example of a visual 'group by' in Dataiku.
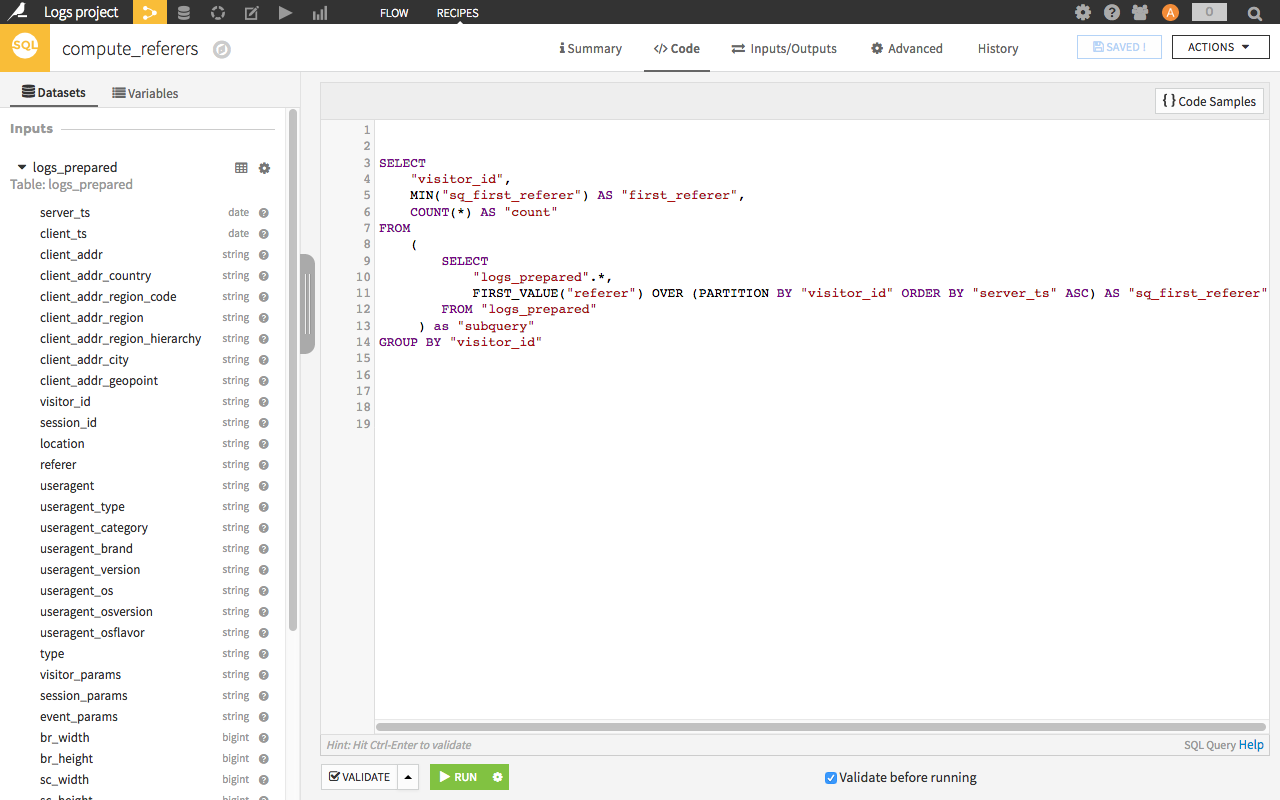
Example of SQL code in Dataiku. Here, it is a window function to get the first referrer of each visitor.
Machine Learning to Surpass Google Analytics
Once I have the users’ data with several variables, I employ machine learning algorithms. The objective is to find correlations or indicators in the data, which are not necessarily visible to human analysts, in order to resolve a defined problem.
There are two families of algorithms:
- Supervised machine learning: After I select a target variable to have explained, the algorithm finds the correlations in other variables in order to explain or predict the target variable.
Example: predicting a conversion. - Non-supervised machine learning: The algorithm finds similar lines (users). The segmentation is automatically calculated from differences in the data.
Example: splitting user behaviors.
With Dataiku, users can perform this work in the visual interface (or in Python or R). In the short video below, I use the example of predicting a conversion on a website. I choose the algorithms (one linear, one based on decision trees) and the variables to be included (default), and change the numeric variable into a categorical variable. Then, I launch the learning process on the data (note: this can take a few moments).
When the learning process is over, I look at the performance of the models created by the algorithms. A ROC AUC of 0.881 tells me at first glance that the model is performing quite well (simply speaking, between 0.5 and 0.7 is okay, between 0.7 and 09 is good, and between 0.9 and 1 is suspicious because it's too good).
Similarly, I look at what the model has learned from the data. Without going into detail, I can see here (in the screenshot) a positive correlation between the number of sessions on the website and the chance of conversion, as well as a negative correlation between visits coming from Google and the chance of conversion.
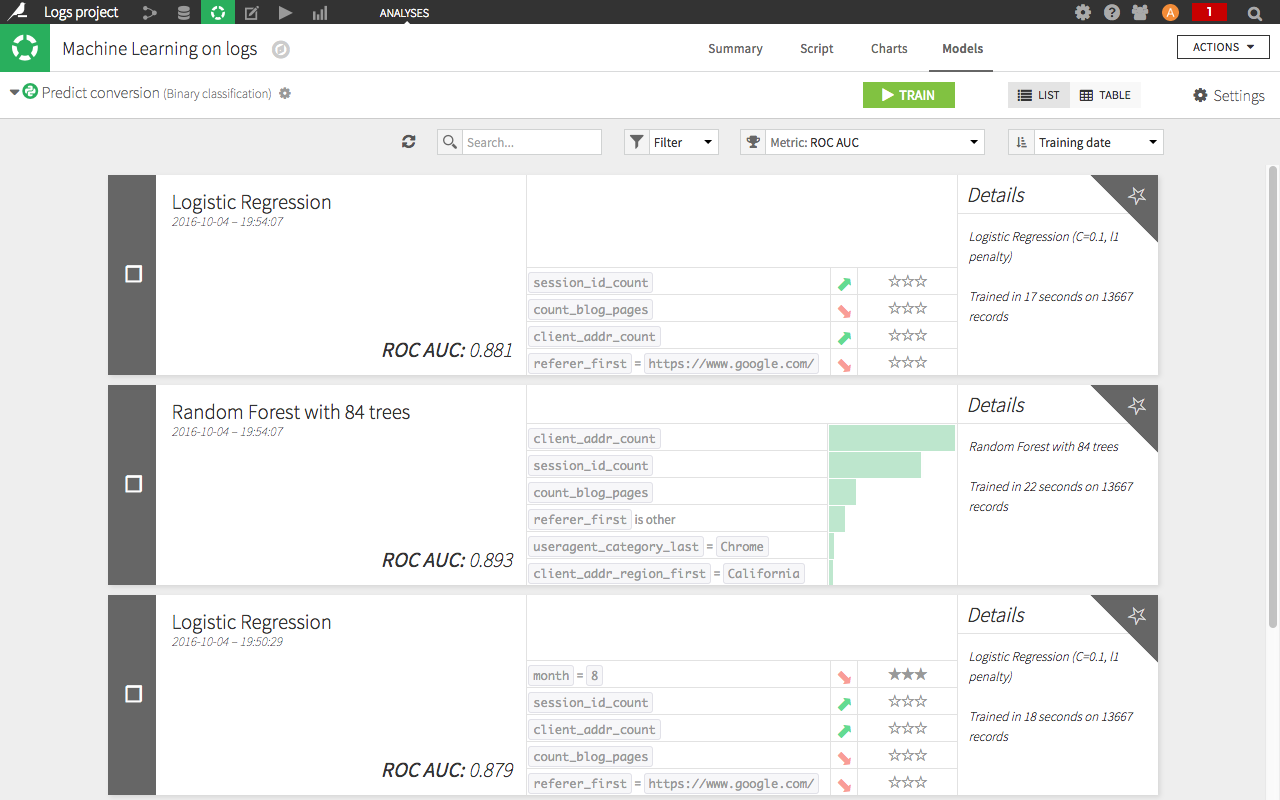
Examples of models trained with predictive machine learning algorithms in Dataiku.
Examples
Companies that wish to leverage their web logs usually fall into the following use cases:
- Optimization of conversion (sales, downloads, etc.)
- Working on recommendations, that is to say suggesting products or content that has the greatest chance of suitability
- Calculating client satisfaction scores or the risk of churn
- Segmentation of behaviors
- Detecting suspicious behavior
These use cases will generate added value compared with descriptive analyses. The automation of obtaining results usually generates some pretty cool uses such as personalized emails or up-to-date scoring in CRM that the marketing team can use in their daily work, etc.
I suggest the use of two complementing resources: a connector that I have developed to retrieve logs of websites hosted by OVH in Dataiku, and an open-source web tracker to embed in a website to collect logs. This tracker, WT1, is very practical and performs pretty well (20,000 events per seconds on a common server).