I recently built a movie recommendation application using Dataiku, so this time, I'll show you how you can do clustering in Dataiku without using a single line of Python code. To stay on-theme, our clustering will be actors and based on features we can get from the movies they’ve played in. Of course, this example can be applied to companies wanting to do clustering on their own customer databases.
*Note: This project was done in an older version of Dataiku. Though the functionalities are the same, the screenshots look a bit different. To see the latest version of Dataiku in action, check out the on-demand demo.
One common error I see when people try to do clustering is that they move too fast into the algorithm phase without preparing the data first. You cannot put your client database in a K-means and expect to have it magically clustered — you have to spoon-feed the algorithm! That means your dataset must be formatted and aggregated in the right way.
Formatting Data for Clustering
My initial dataset is a movie dataset. First, I have to transform it to an actor dataset. A column of my data is a list of actors; I used the split and fold processor in Dataiku to reshape it correctly. Just like that, my dataset of 7,000 movies is now a dataset of 17,000 actors.
Feature Aggregation
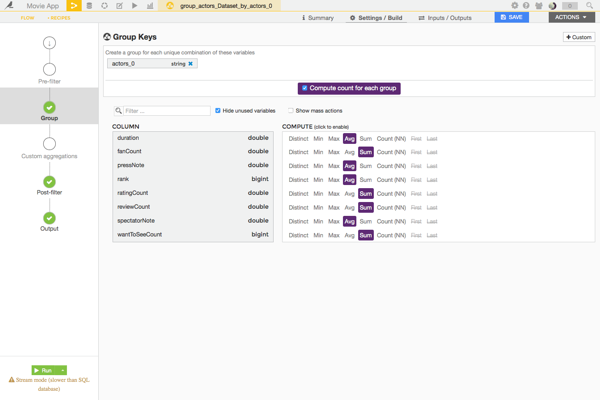
Now I want to aggregate my dataset by actors, because some actors appear in several movies. To do this, I used the Dataiku grouping recipe. To keep it simple, I aggregated on numerical features and do operations, like average or sum:
- Proportion of American movies they were in
- Average duration of their movies
- Sum of fans of their movies
- Average press and spectator rating
- Sum of user ratings
I also activated a post filter to keep only actors who were in at least five movies.
Clustering Data with the Algorithm
Clustering is a method of discovering pattern in data; in my actor clustering, I expect to see a cluster with Hollywood superstars, another with popular French actors, and so on. There are several clustering algorithms in Dataiku: K-means, ward hierarchical clustering, spectral clustering, DBSCAN, and more.
For the features, it is suggested to rescale it by average and standard deviation. Dataiku does it by default for your numerical features. Then in the algorithm tab, you can select several algorithms, several numbers of clusters, and run all the experiments at a glance.
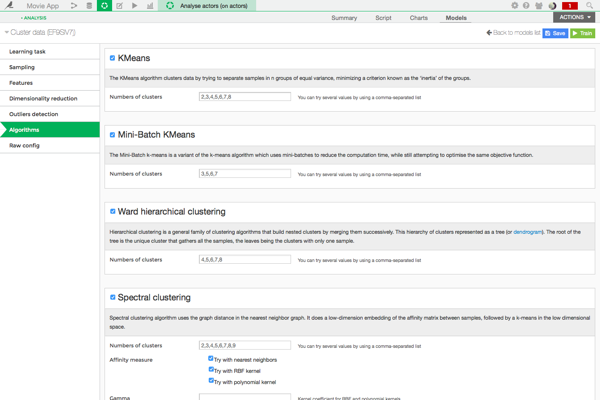
Now, you may or may not have an idea of how many clusters you want; but, often, it isn’t that obvious. To find the best one, or at least a correct one, you can check the silhouette. Silhouette coefficients near 1 indicate that the sample is far away from the neighboring clusters. A value of 0 indicates that the sample is on or very close to the decision boundary between two neighboring clusters.
So the higher the silhouette score, the better your clustering should be!
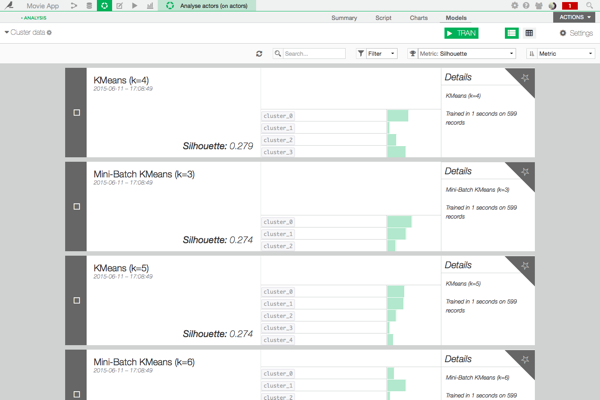
Here, my best clustering seems to be a K-means with four clusters. Let's have a look. The first thing I usually check is the heat map of my clusters:
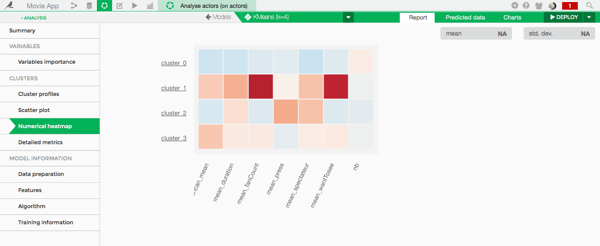
It reveals how the clustering algorithm groups the data. Here I can guess that cluster one is Hollywood superstars with lots of fans. I'll guess that cluster two represents “all fame” actors: good movies, but few fans. Cluster zero and two contain more French movies, one and four contain more American ones.
You'll notice that American movies have much better ratings and fans than the French ones! Furthermore, superstars appear in longer movies, and are not always liked by the press.
Visualize the Clusters
As soon as my clustering was done, I created a way to visualize it.
Cluster 0: the French mafia.

Cluster 1: the Hollywood superstars.

Cluster 2: the "legend" actors.
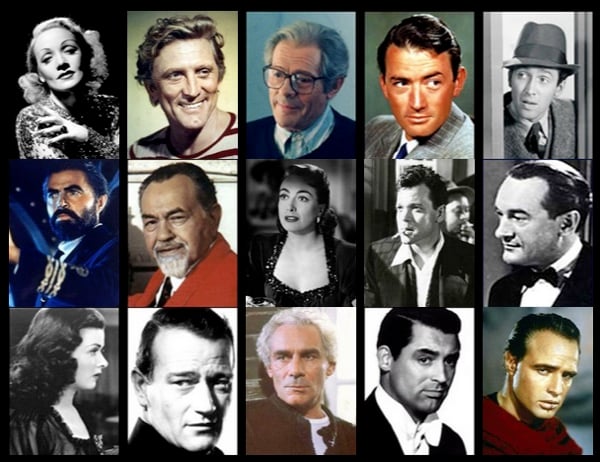
Cluster 3: the American stars.

Voila! And this literally took me one hour.


