Data has to be updated as new analysis needs come along, but in complex, multi-project data pipelines where data is heavily interconnected, more often than not these updates lead to unintended consequences. Even small tweaks can cause issues that range from numbers being slightly off in a dashboard to complete project breakdowns.
However, when the connections between data are unknown, gaining visibility into these impacts before they occur or understanding the root cause of those changes afterward becomes nearly impossible. This is where data lineage comes into play.
What Is Data Lineage?
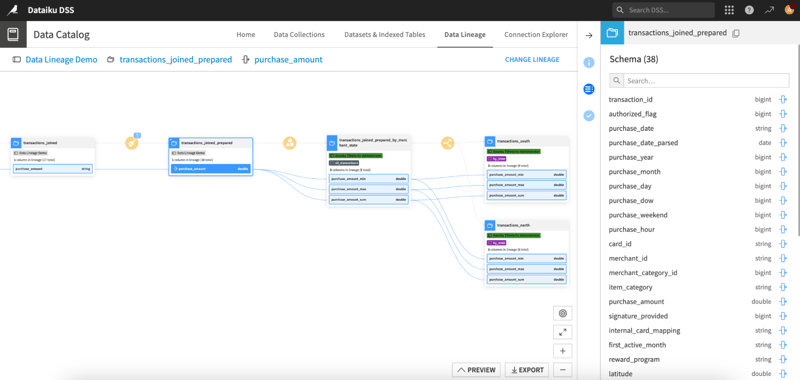
Data lineage is a representation of all the transformations applied to a given column across datasets and projects, both upstream and downstream. Think of it as a map that shows every twist and turn data takes — detailing the column sources, transformations, and destinations. With proper lineage in place, data teams can trace data-related issues back to their root causes and assess the potential impact of a change on downstream systems.
Data Lineage in Root Cause Analysis
When errors or discrepancies arise in your data, performing a root cause analysis is critical to finding the source. Without data lineage, identifying where the issue originated can feel like searching for a needle in a haystack. Did the error stem from incorrect data ingestion? Was it caused by a faulty transformation or an issue in a downstream system?
Data lineage simplifies this process by providing a visual map that shows you exactly how a column’s data was modified and highlights where issues may have occurred. By tracing the problem back through its lineage, you can quickly isolate the faulty step in your data pipeline, saving time and preventing future errors.
Suppose a key business report contains inaccurate figures, and the team needs to find out why. Using data lineage, you can trace the data backward, from the final report, through each transformation and aggregation step, all the way to the initial data source. This helps identify whether the issue was with data collection, an incorrect calculation, or a faulty transformation rule, allowing you to fix the problem at its origin.
Data Lineage in Impact Analysis
When making changes to a data pipeline — whether modifying a dataset, transforming data, or updating models — understanding how those changes will affect downstream applications is crucial. This is where impact analysis comes into play.
Data lineage enables you to clearly see which systems, reports, or models rely on a particular column in a dataset. By understanding these dependencies, you can anticipate potential disruptions or inaccuracies that might arise due to your changes.
For example, if a financial dataset needs to be enriched with the numbers of a new region, but it’s used in multiple projects for reports and dashboards, there’s a high probability that the change will affect those downstream solutions. Data lineage lets you visualize all the downstream projects and models that this column is associated with, which allows the team to take preemptive actions, such as updating reports, adjusting models, or notifying stakeholders, before any issues or confusion arises.
Data Lineage, Now in Dataiku
Data lineage is now accessible from many locations within Dataiku — from the prepare recipe to the data catalog and more — allowing you to easily trace lineage between columns across all projects.
 Easily conduct root cause analysis and impact analysis with data lineage in Dataiku.
Recently, Dataiku released a suite of data quality features to improve visibility into data quality in Dataiku that can alert you to quality issues in your data. Now, with data lineage, you can go a step further to diagnose the cause of any data quality rule failures for faster troubleshooting.
With data lineage, Dataiku gives you more observability over your data, so that you can ensure your insights are built on a solid foundation.


