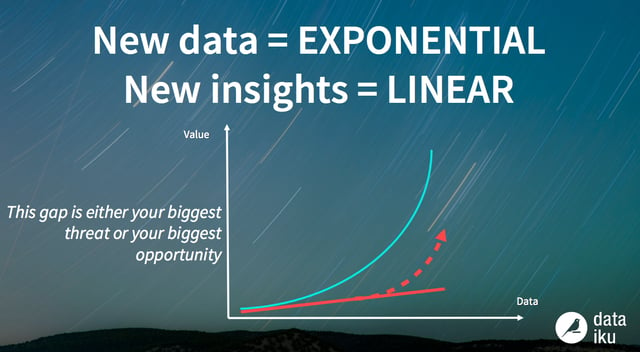
Today’s companies don’t have a data problem - they have a data value problem. We talked about this a lot in 2017 (here’s just one example), but alas, it’s still a major challenge that many businesses face in the new year.
Stéphanie Hertrich, Cloud Architect at Microsoft, recently interviewed Clément Stenac, co-founder and CTO here at Dataiku. They spoke a lot about this very challenge, specifically how we got here and what companies can do today to evoke change.
On Data Preparation vs. Insights
Data preparation steps are said to take up 80 percent of total time while exploration and analysis only represent 10 to 20 percent of the time. What’s more, many tools for exploration and analysis can only be used by companies that are very technically advanced - those with data as their core business who therefore have data engineers and data scientists in droves who can deal with data pipelines.

But more often, you have companies where data is not their primary business (mid-sized retailers, utility companies, etc.). They can’t possibly do data exploration and analysis from scratch - they need tools.
Editor’s note: For more on this topic, check out “Why Teams Need Data Science Tools.”
On the Advantage of Data Science Tools
The 3 fundamental features are:
- End-to-end: The ability to cover the entire data development cycle, including acquisition, preparation, ETL (grouping, filtering, joins), and downstream phases such as machine learning or data visualization.
- Collaboration: Being able to work with several people simultaneously on a project and addressing the issues of access control, versioning, and rollback to avoid conflicts. Also important is automation, including being able to start a workflow automatically or monitor data sources.
- Code or Click: Hadoop, despite its integration features remains a tool for developers. So for a data analyst, it’s nearly impossible to use it directly: instead, it’s better to add an abstraction layer and tools above the technical bricks. Developers should be able to code in a streamlined, high-quality environment (with versioning, code traceability, etc.) And meanwhile, non-developer profiles (who have business knowledge and are often a larger team than the developers) should be able to work with data as well without having to code or complexity of setup. This model frees up time to focus on machine learning and advanced processing.
On Data Team Roles
The difference between data scientists, analysts, engineers, etc., is specific for every company - it’s more of a spectrum. In general, data scientists work more with elements of machine learning, algorithms, mathematics, and statistics - and generally, they code. Meanwhile, the data engineer is more concerned with data systems and infrastructure, specifically running data pipelines. And the data analyst holds more of the business knowledge and generally prefers to work using visual tools.

There is also the data team leader, who is often responsible for selecting tools. His or her primary concern is with the productivity of the team, but also with governance and traceability to ensure that data is safe with central, controlled access.
Today, data scientists are extremely sought after, so naturally, there’s a lot of turnover there. A data science tool can help with this problem by blurring the spectrum between data scientist and analyst, allowing the latter to push further into the traditional territory of data scientists without having to code.
On Managing Schema Updates
Schema updates are a notoriously difficult problem to handle in the world of big data, so how can they be managed? Well, data format updates are not magic: users will have to create multiple branches in their flow and then match those by defining dispatch rules: e.g., the data matching the old style goes through one branch while the newly styled data goes through another. The world of Hadoop is very “schema-full,” - you would rather normalize ahead of your workflow. In any case, efficient processing probably means using binary or column-oriented storage types, hence with a schema.
On Algorithm Choice and the “Black Box”
The question of choosing algorithms at times is one of explainability rather than performance: some are very powerful, but we don’t actually know how to explain how they work. This can create problems of trust in the algorithm itself. It also notably starts to pose legal problems; the EU General Data Protection Regulation (GDPR) touches on this very topic.
Editor’s note: For more on GDPR, download the white paper.

Because it’s often necessary to be able to explain decisions made about, on, or for a user by an algorithm, some businesses for certain use cases may not deploy the most powerful model, but rather the one that offers the best balance between performance and explainability. This is a very promising (albeit young) research topic: algorithms that can explain predictions, even those coming from a so-called black-box algorithm.
It’s also true that the most successful algorithms are too resource-heavy, so there is a real business decision when it comes to the final choice of the algorithm.


