


This article presents how financial modeling can be done inside Dataiku. Let’s begin with the context: spreadsheet-based tools like Microsoft Excel are some of the most popular tools for financial modeling and are used for all kinds of tasks including investment analysis, P&L modeling, and risk management. Why is that the case? Spreadsheets have convenience benefits, they have been around for a long time, and they will continue to be around for the foreseeable future. However, they also have some downsides. Namely, the interfaces are semi-structured and brittle, especially when it comes to large volumes of data and lack of scheduling automation.
At the core, spreadsheet-based tools bring data to the forefront and keep the calculation logic in the background, for your reference. You can view the dependency graph for a specific calculation, but it could get challenging to figure out where the entire story begins and ends — interconnections between calculations and data — within a multi-tab spreadsheet. Real-world spreadsheets tend to become complex over time which presents difficulties in understanding and maintaining work. And if you want to do custom stuff, then you have to write VBA macros which require a completely different skill set.

Spreadsheets are certainly not ideal for enterprise development where you have portfolio teams building, maintaining and collaborating with full traceability on stocks selection (i.e.,within a sector there is a need for the output to flow in an automated fashion into a more holistic workstream like portfolio construction). While spreadsheet-based tools are mostly cloud based, there are no pushdown capabilities to leverage other compute options when dealing with operations on large volumes of data pulled from various sources. It’s also difficult to connect to different types of sources, such as API services.
That brings us to Dataiku which is structured as a visual pipeline for performing calculations and other operations on data. Dataiku brings the calculation visual flow to the forefront so users can view the input data, operation, and the results from the operations by clicking on each step in the flow. That’s the fundamental difference in terms of the interface. Dataiku also provides data profiling features to identify and automate data quality checks to spot human errors, which are a primary cause of spreadsheet problems.
In this blog post, we will outline how NPV/IRR/payback period, P&L construction, and market beta calculation using regression examples can be replicated in Dataiku.
NPV/IRR/Payback Period Using a Spreadsheet-Based Tool
In a typical financial modeling example, you are going to find five types of sections. The sections outlined below represent some of the common aspects of any spreadsheet model, even beyond financial modeling.
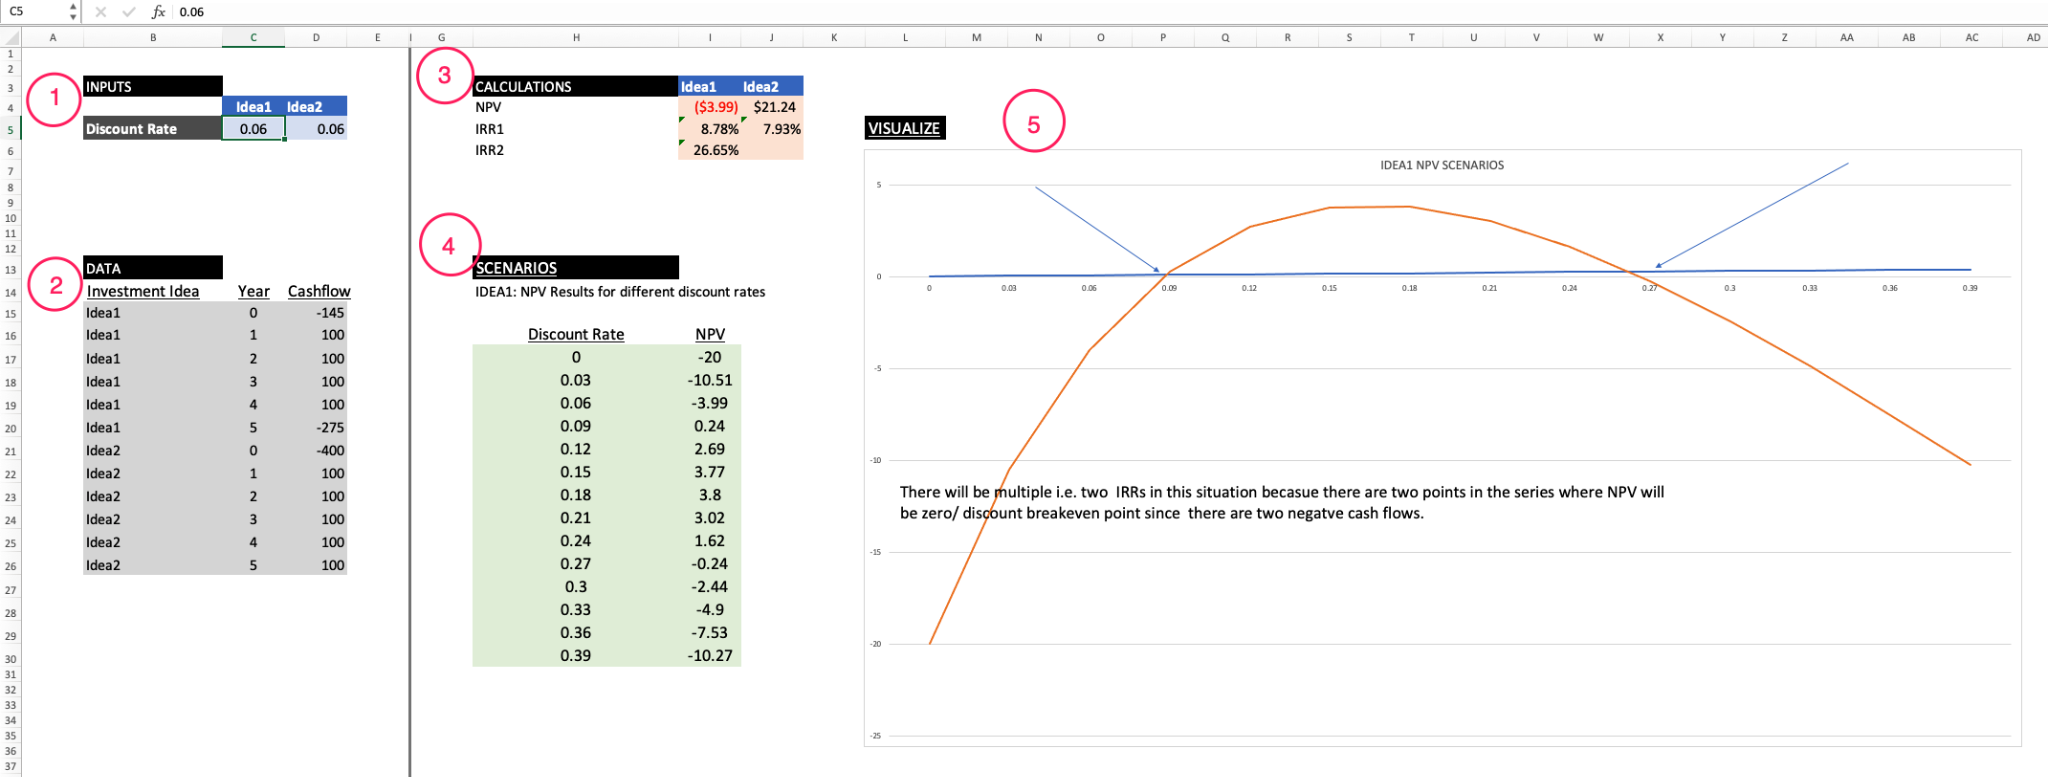
As you can see, the sections are:
- Placeholders you can change (i.e., your model’s assumptions)
- Static input data
- Interim calculations and the calculations you are ultimately interested in
- Calculations under various model assumption scenarios
- Calculations and scenarios data visualization
Below, you can see the fully built out Dataiku flow for IRR/NPV/payback period:
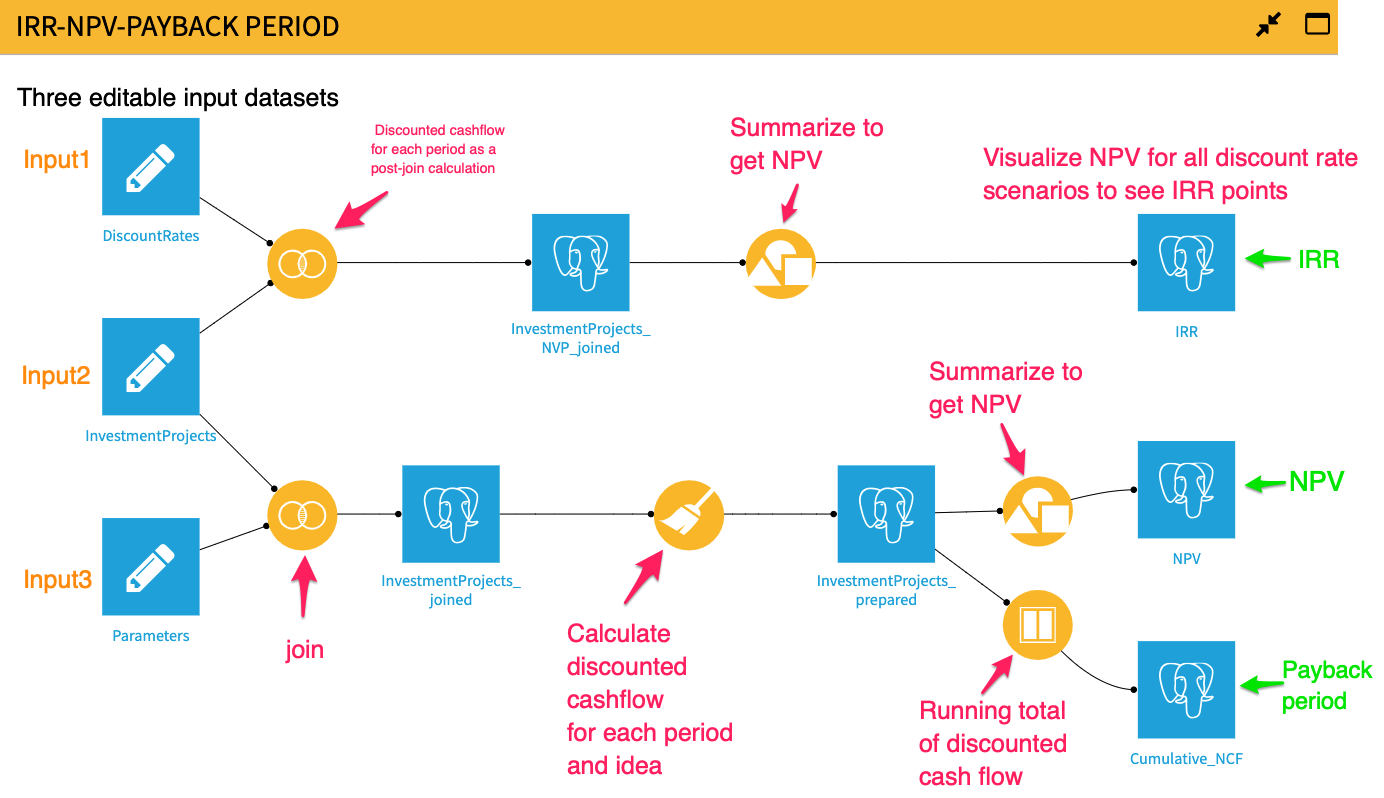
Step 1:
We place our discount rate (model assumption), future cash flows (data), and discount rates 1-40% (multiple discount rate scenarios) into three separate editable datasets. We chose editable datasets because they are different from other Dataiku dataset types. They can be modified from the Dataiku UI or through a Dataiku application.
Step 2:
We join data to discount rates to create a single dataset. Unlike a spreadsheet where you do cell references, you have to Join disparate datasets so that you can reference columns/fields for calculations.
Step 3:
We then create a formula step in a visual Prepare recipe to calculate discounted cash flow for each investment idea and period.
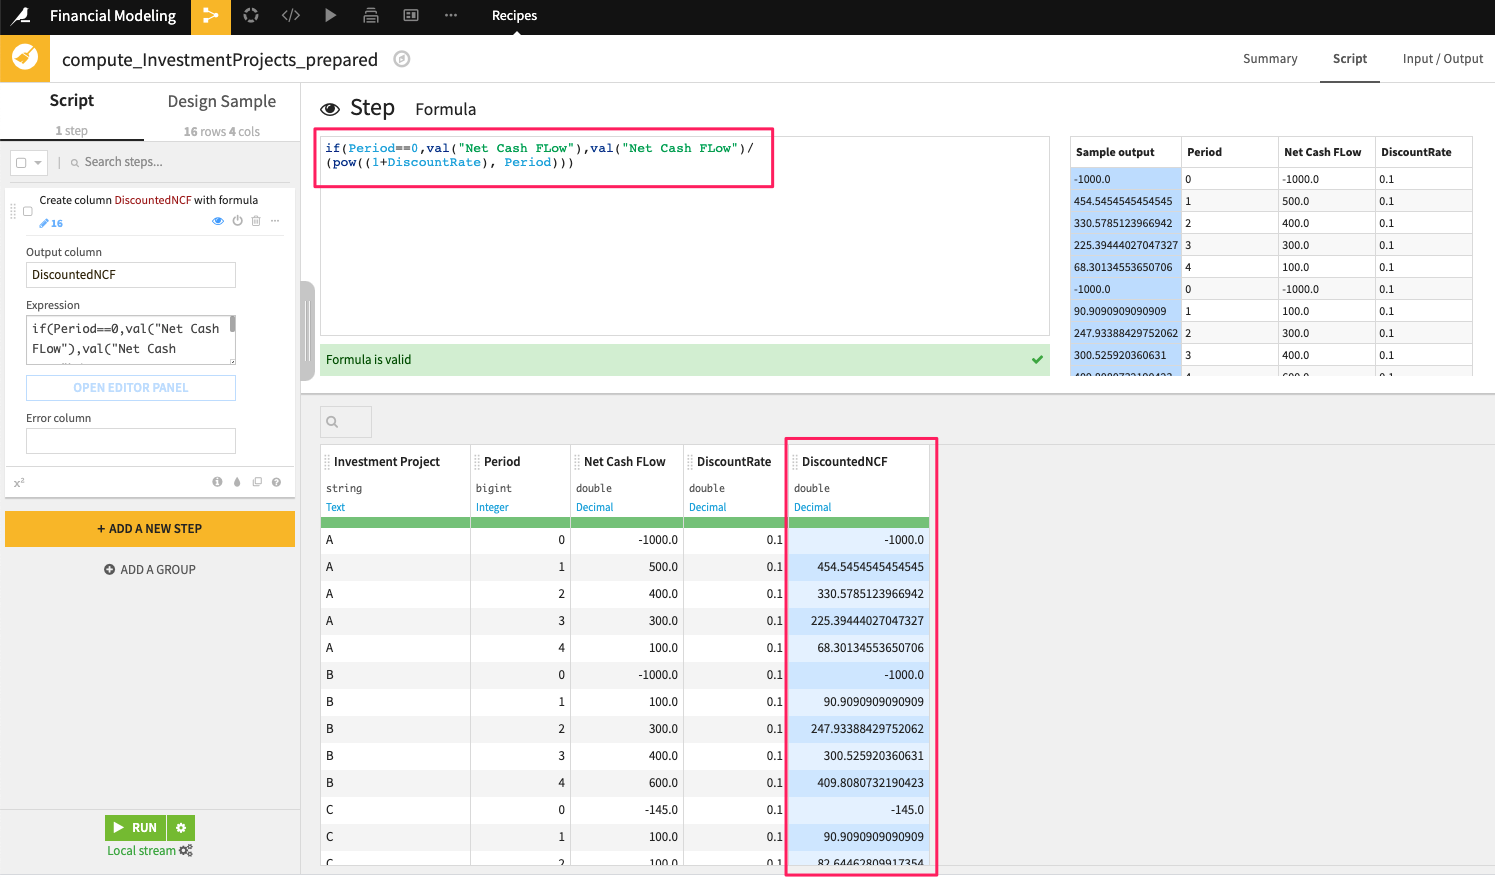
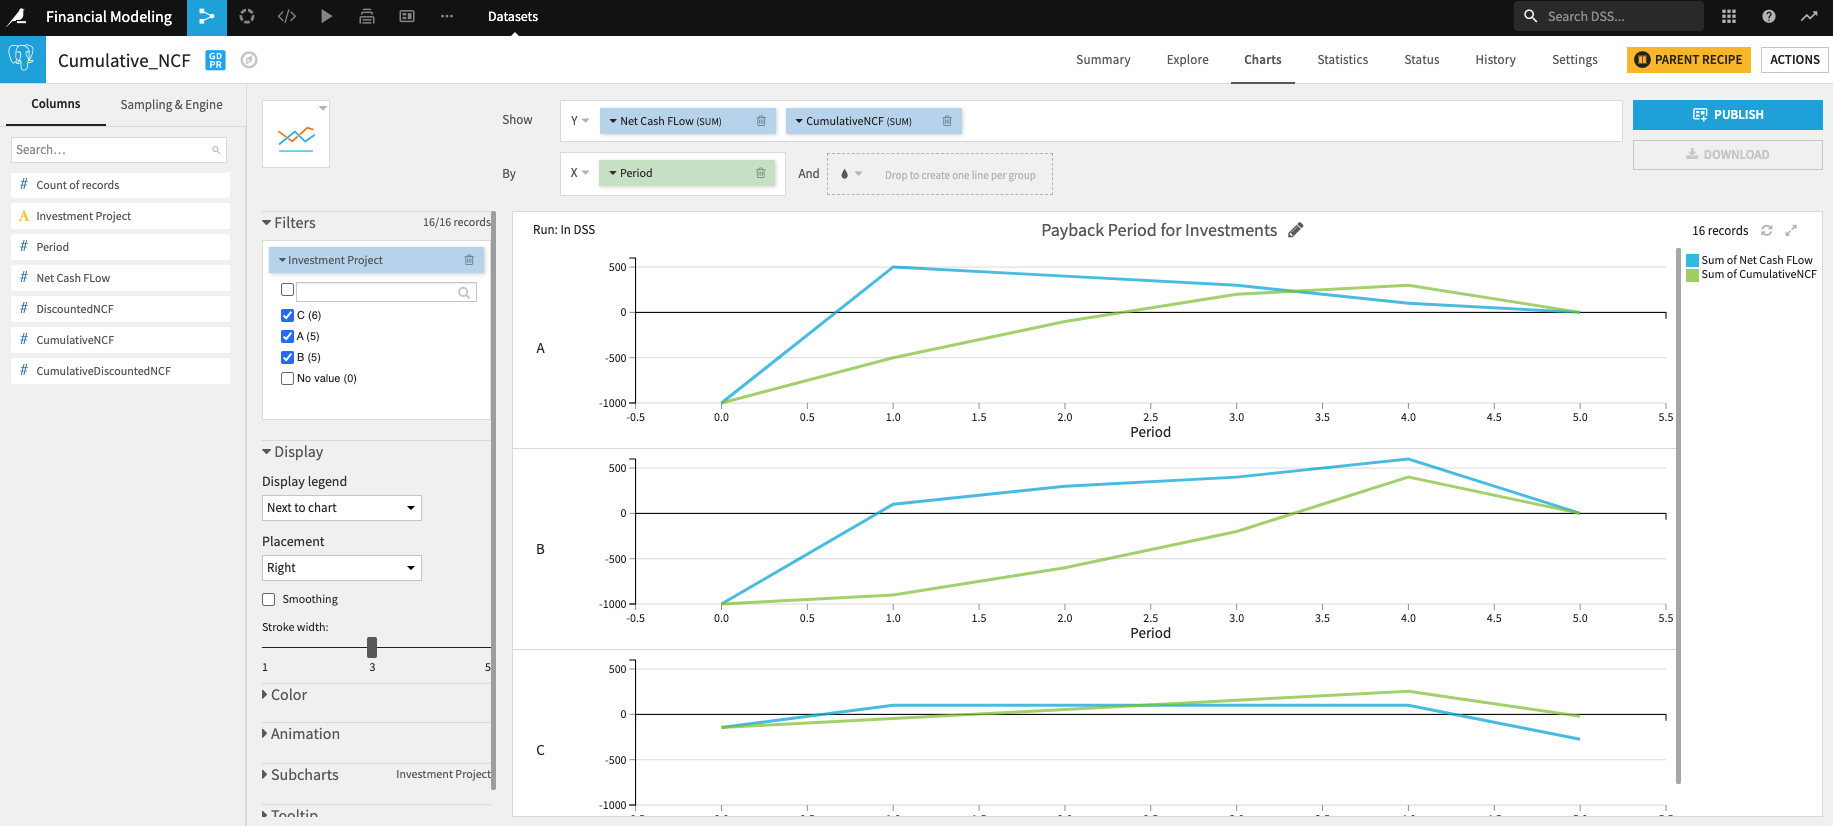
The benefit of doing this is two-fold: We can now sum up the cash flows to arrive at the net present value, but we can also show how the discounted cash flows situation is progressing using a Windows recipe to see what the payback period for the investment is.
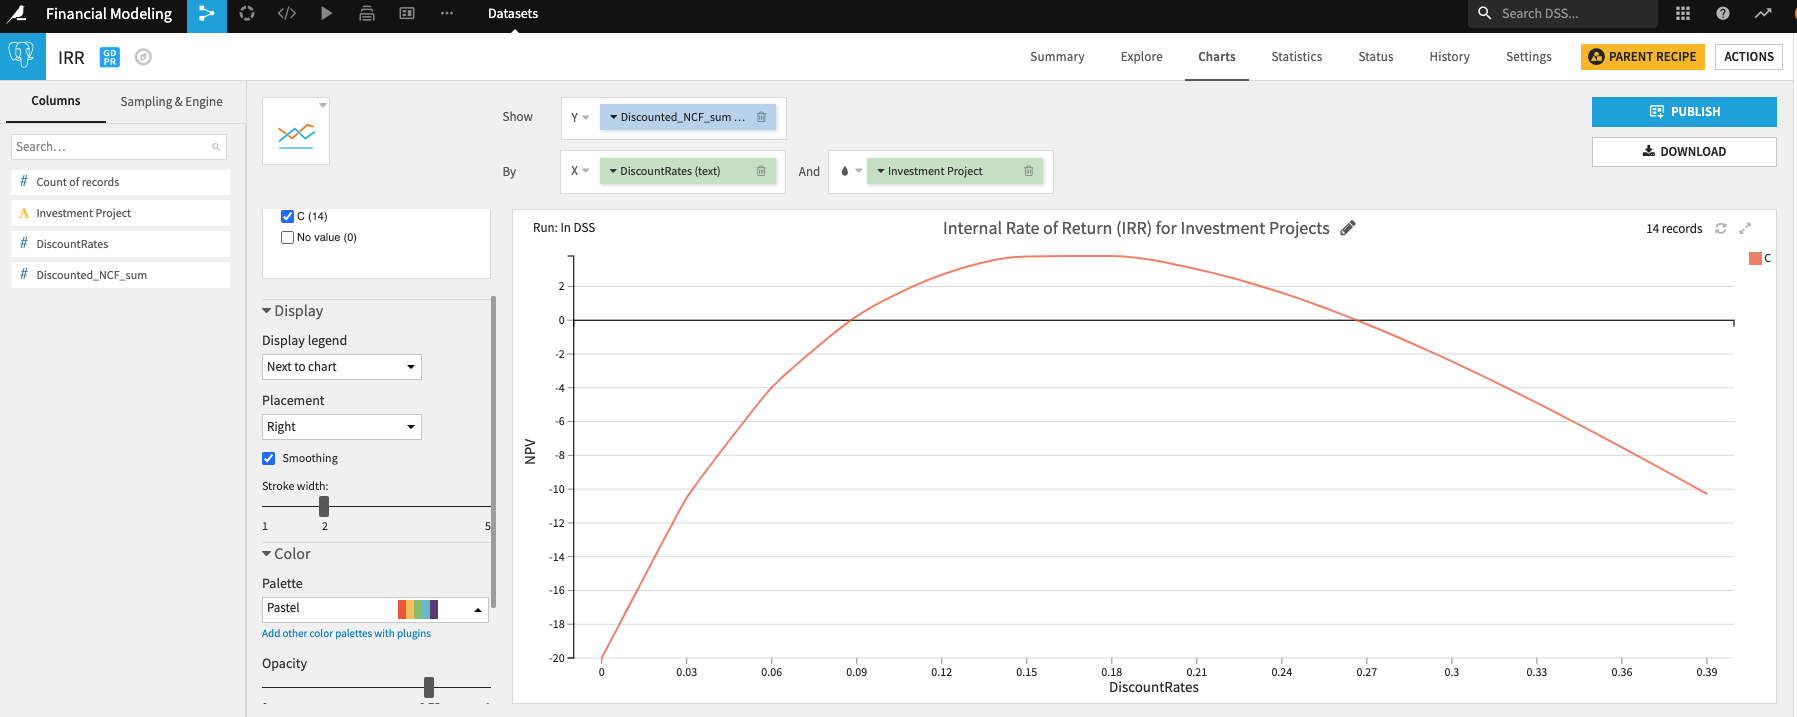
By visualizing our results, we can show the following:
IRR: We can see that there are two IRRs since it has two negative cash flows for this investment idea.
NPV:
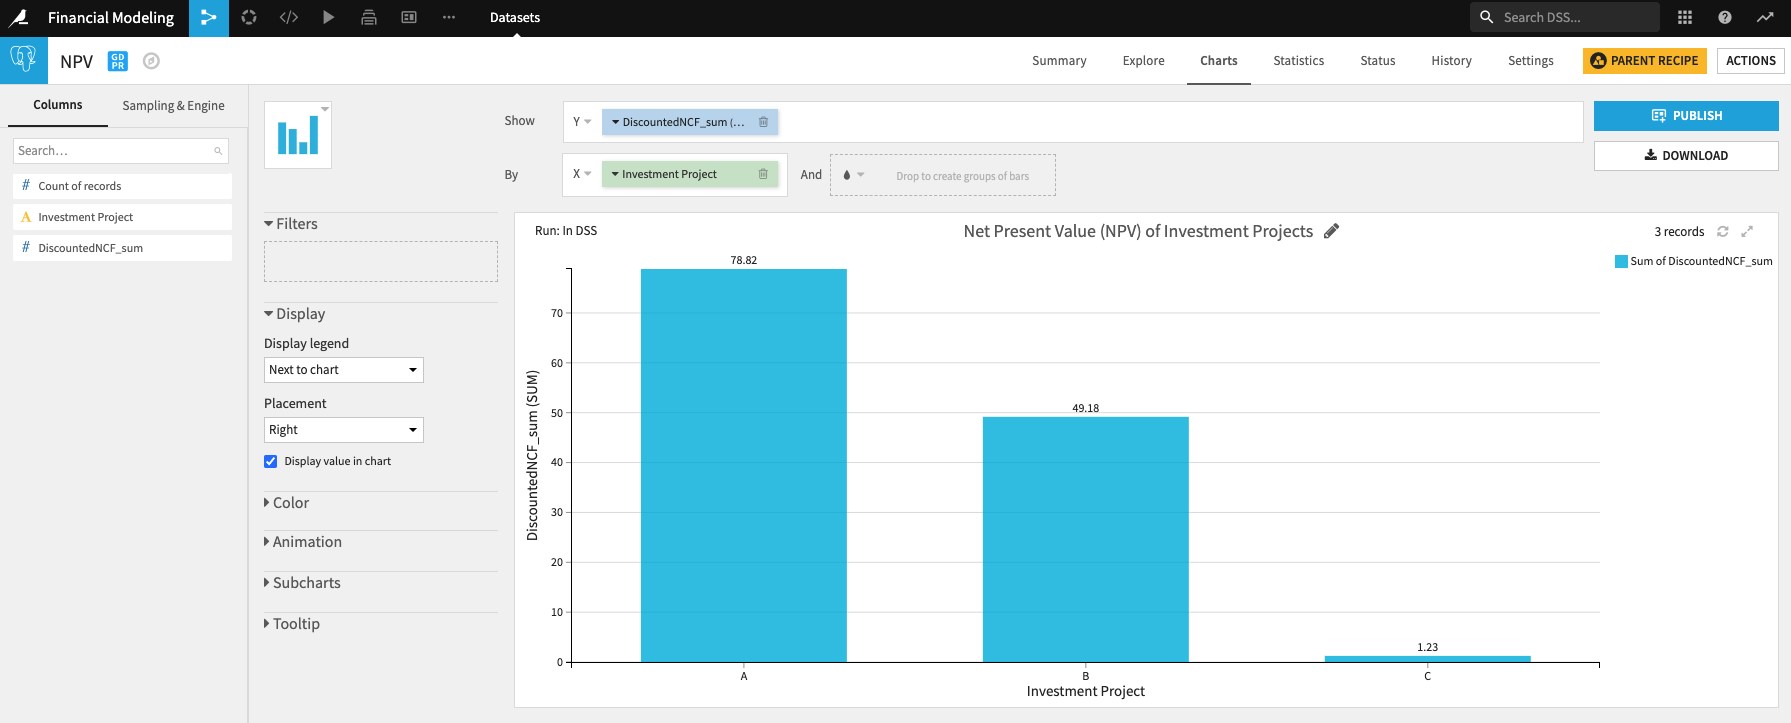
Payback period:
P&L Construction Using a Spreadsheet-Based Tool
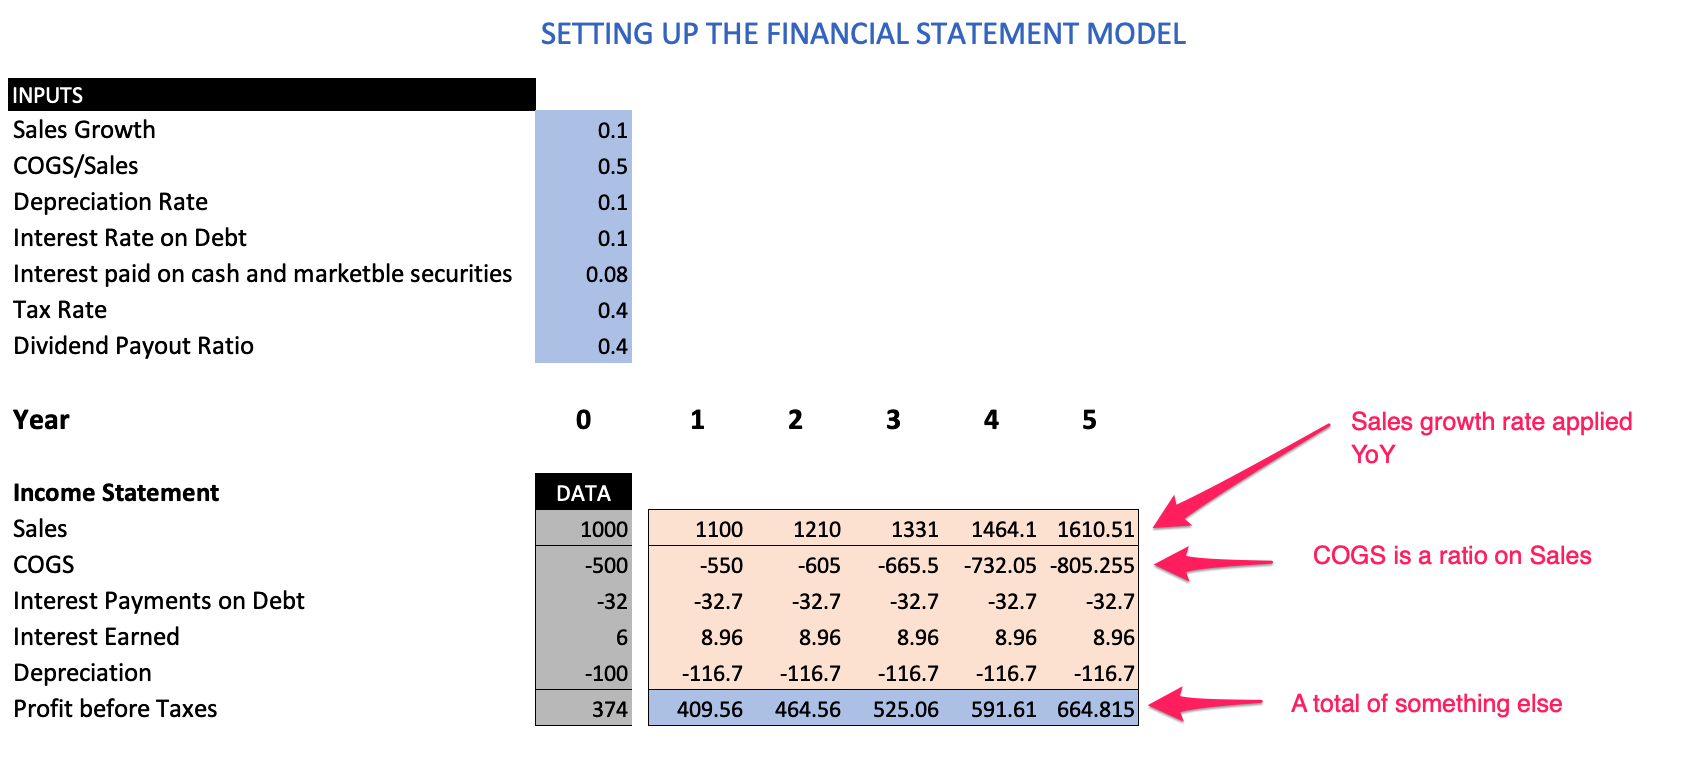
Here, the key aspects include:
- Calculations that are based on compounded annual growth rates (CAGR) and are applied in a horizontal orientation going left to right (i.e., sales year one through five)
- Calculation items that are a ratio function of something else (i.e., cost of goods sold)
- Calculations that are summations based on other calculations or subtotals
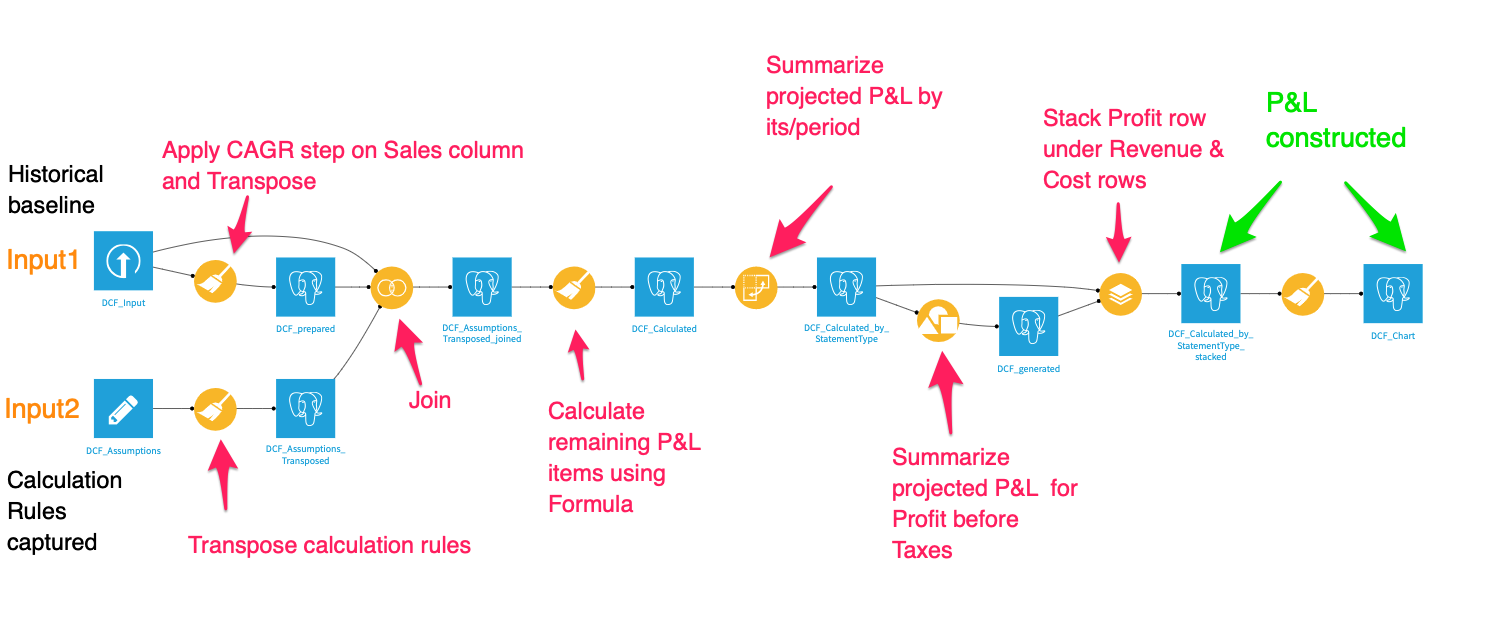
Step 1:
We upload our historical baseline data (input 1). This could very well come from any data source (i.e., Snowflake). The second input is where we capture our calculation rules which need to be structured in a specific format so it becomes easier to do calculations for each P&L item downstream.
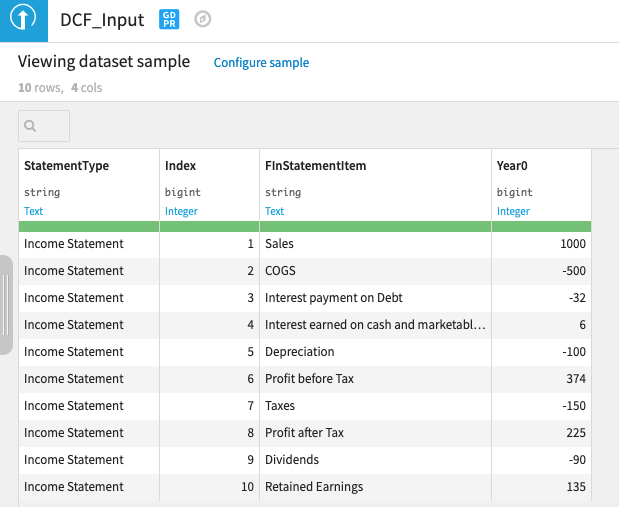
Input 1: Historical baseline
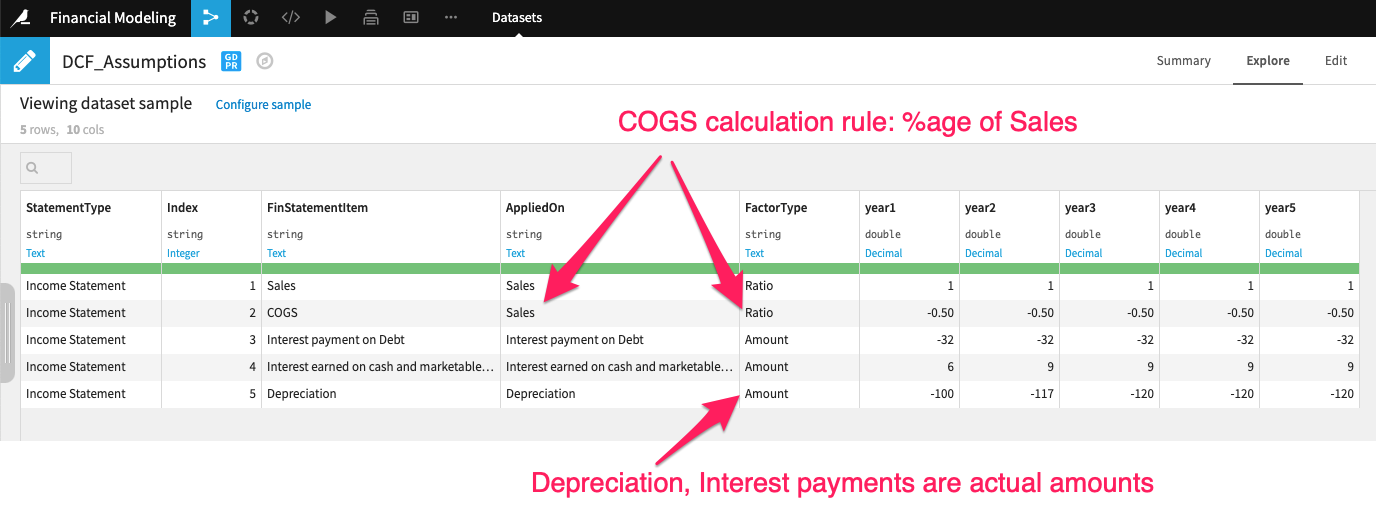
Input 2: Calculator rules
The calculation rules (dataset) specifies if a value for each P&L time for a given period is a ratio proportion applied on itself or something else (i.e., COGS is a ratio applied on sales). Alternatively, it could just be an amount, in which case no calculation is needed (i.e., interest payment on debt).There is also an Index column that we can use to sort P&L items in a specific order.
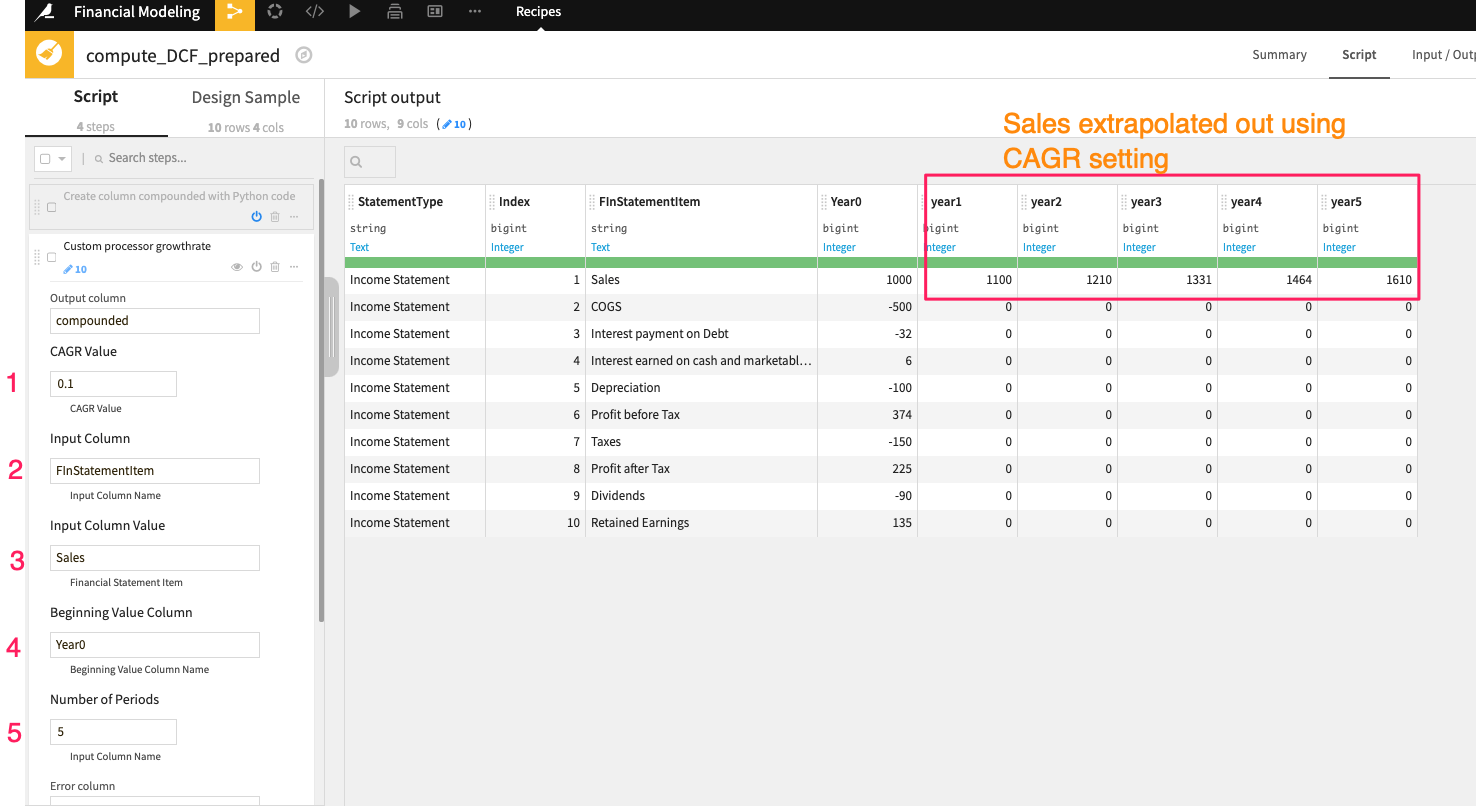
In order to calculate the sales out into year five, we use a custom step “Growth rate” in the visual Prepare recipe. You can specify the “Starting Column” values, CAGR, and number of periods.
Now, we join the datasets together using a visual Join recipe. More importantly, one of the conditions in the Join recipe is based on joining the “AppliedOn” column in the calculation rules dataset to the “FinStatementItem” column from the historical baseline dataset. We do this to map each P&L item to its corresponding calculation rule and its elements.
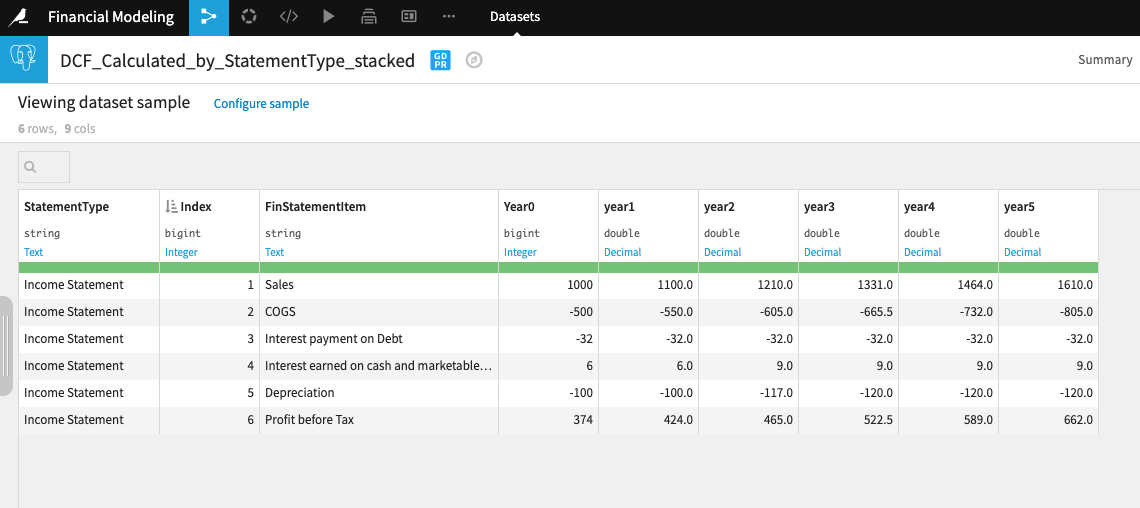
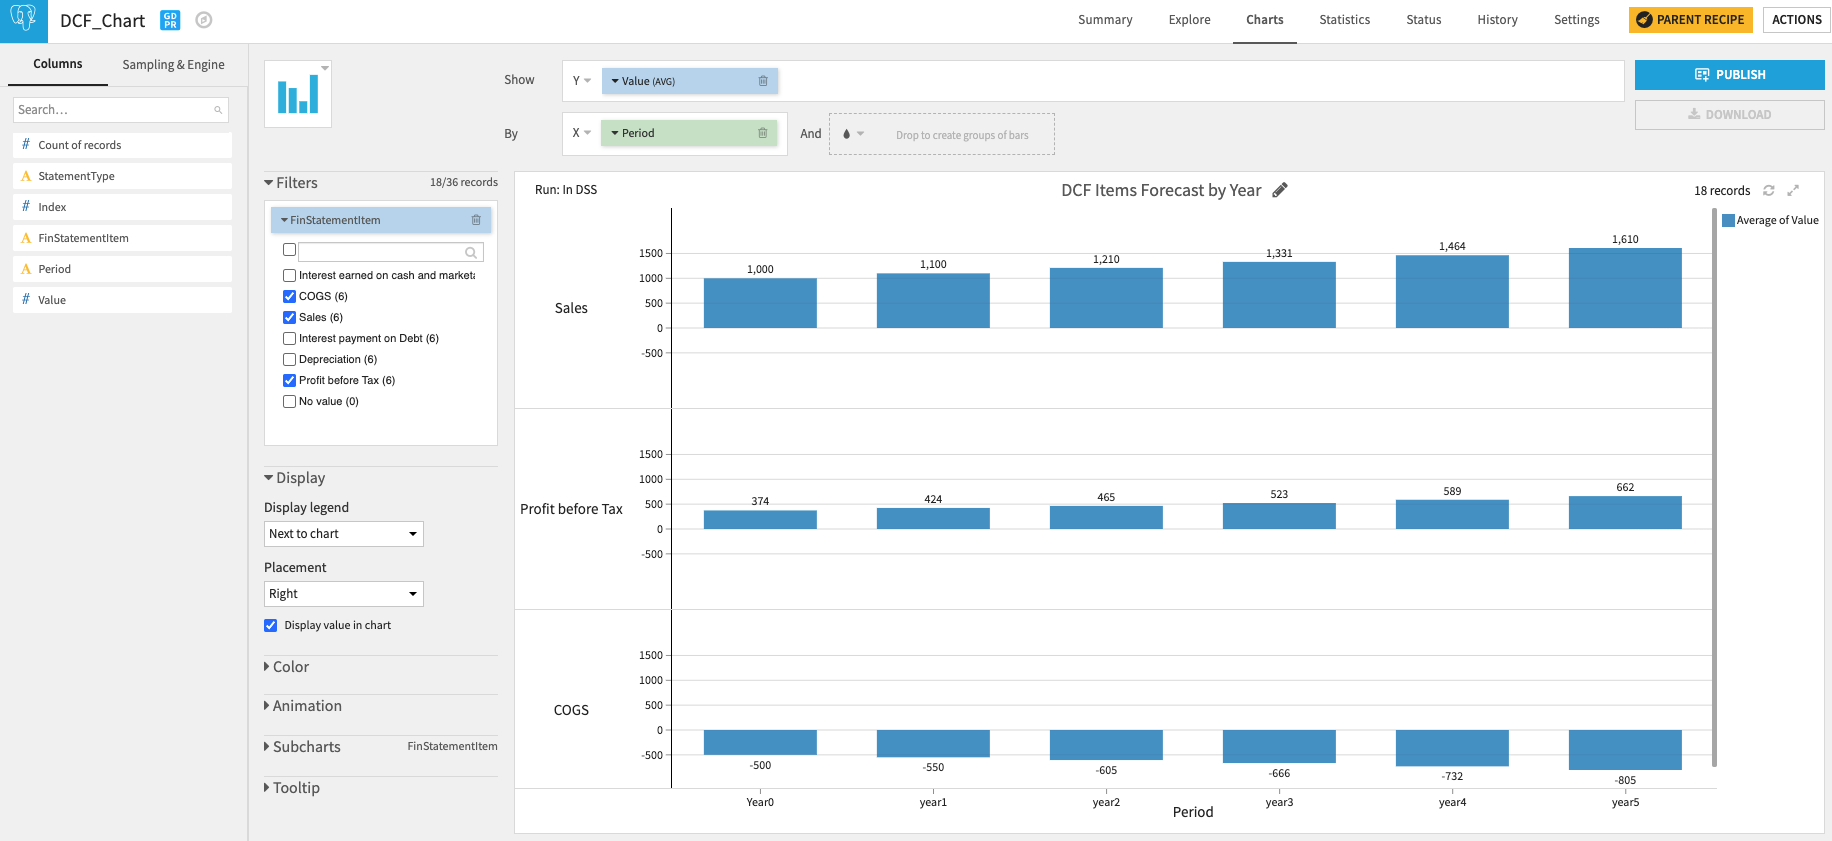
After a few reshaping operations, we end up with a constructed P&L, as you can see below.
We can visualize the P&L projections and publish them into a Dataiku dashboard.
We can also package this Dataiku flow into a Dataiku app and share it with business users who can then upload their own historical baseline and calculator rules to get outputs that are specific to their inputs. This is a popular way Dataiku flows can be consumerized in the form of applications. By putting data into the hands of many (even those who aren't involved in model creation and development), organizations enable wider teams to consume insights, which ultimately leads to better day-to-day decision making.
The examples discussed above are a small subset of the financial modeling examples. Furthermore, Dataiku can also be used to conduct and operationalize machine learning techniques into the analytical process, illustrated in the example below.
Dataiku Visual ML Example:
The capital asset pricing model (CAPM) is a key input into equity valuation exercises — it basically calculates the cost of capital in order to discount cashflows. The CAPM derives the firm's cost of capital from its covariance with market return to get the actual beta 𝛃 calculation. It basically shows the sensitivity of a stock or portfolio's return to the market return.
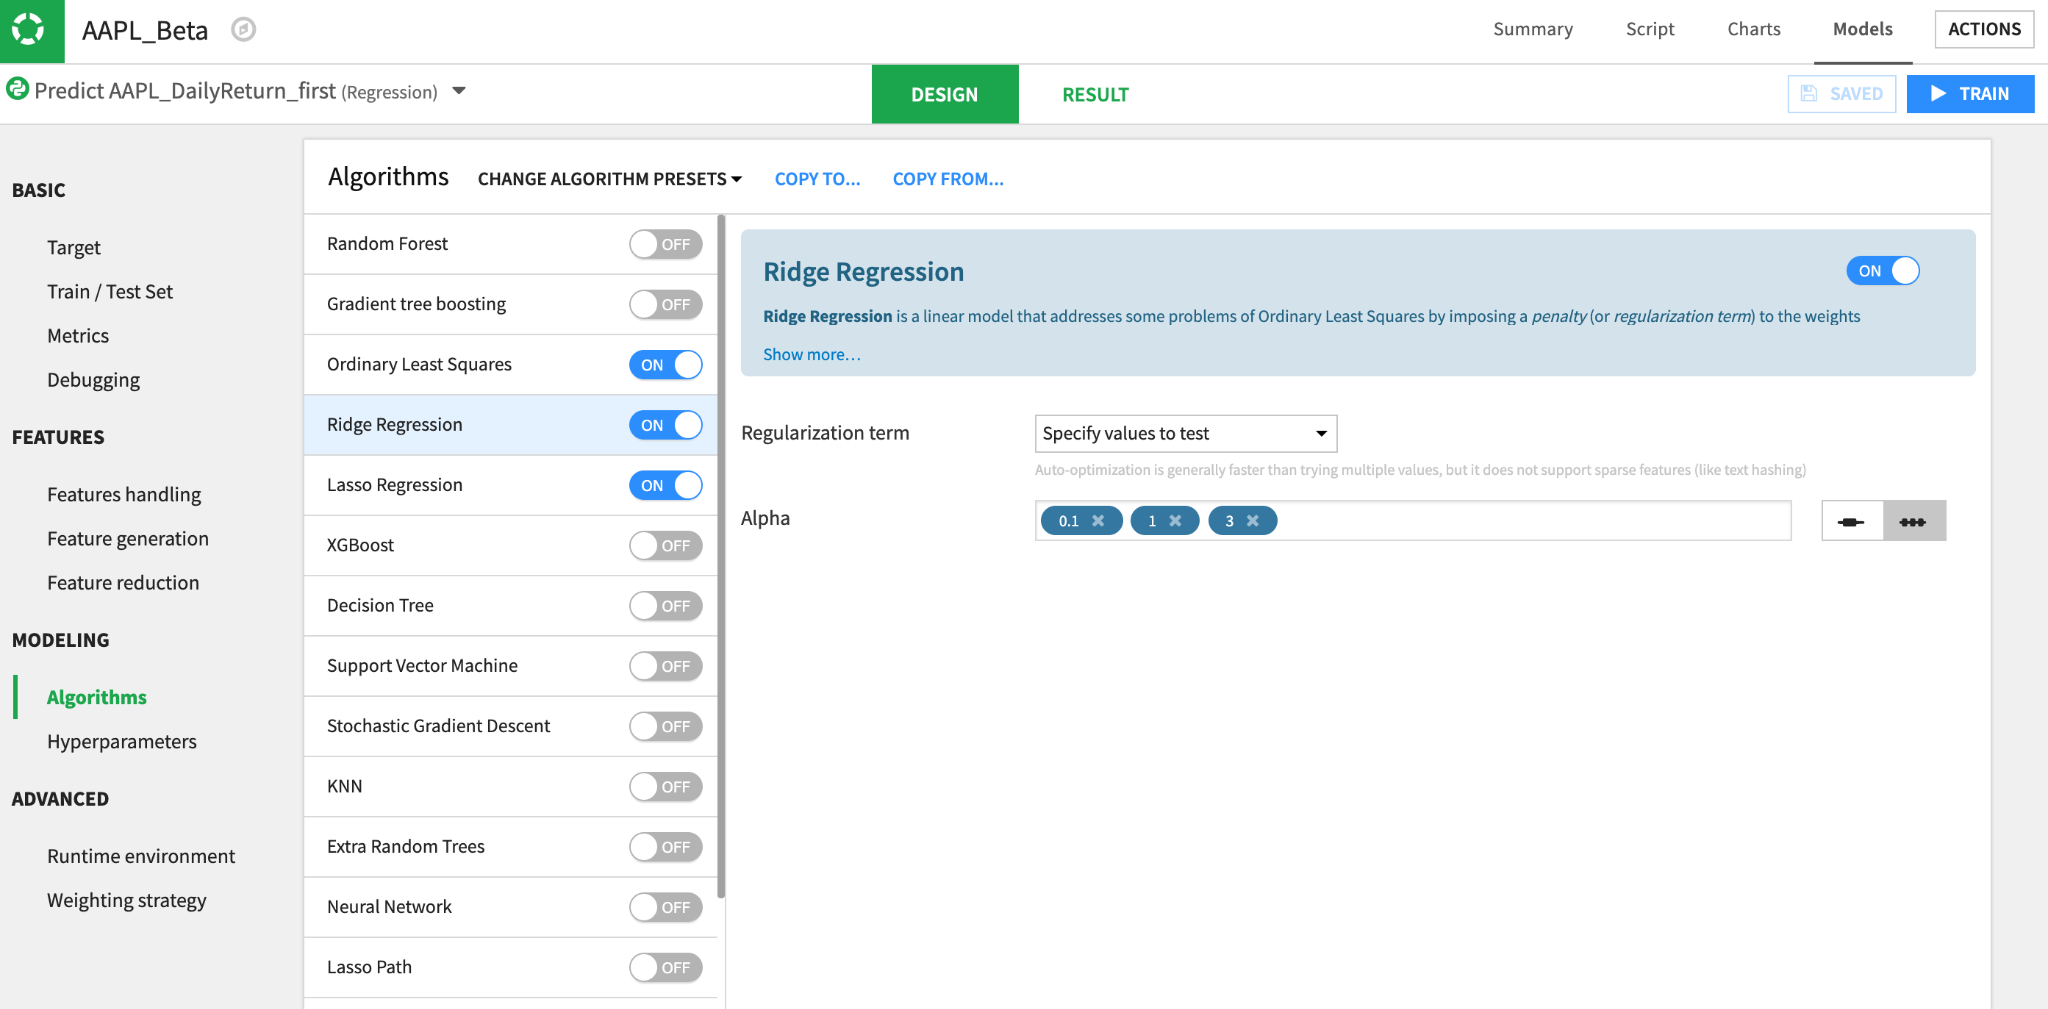
Alternatively, you can calculate beta by running a regression using log returns of S&P 500 log returns (independent variable) with a stock's return (dependent variable) to get the regression coefficient. In Dataiku, you can do this programmatically using a Python code recipe or through our visual ML. See the catalog of regression algorithms below.
Here's an example of the regression coefficient (i.e., market beta with the corresponding t-statistic and p-value*):
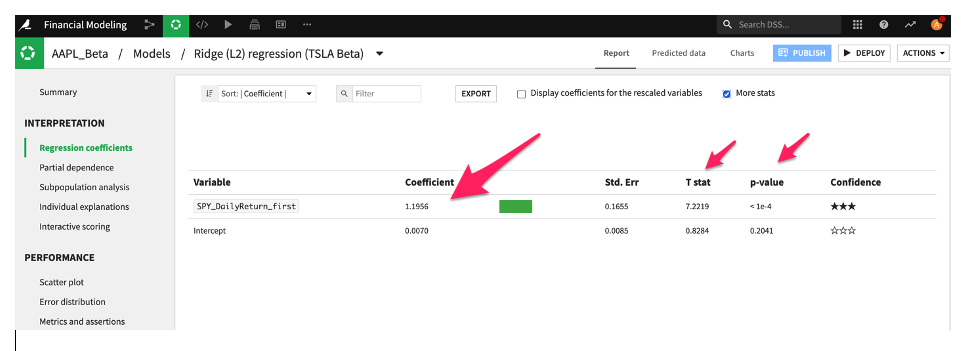
*Overfitting has always been a potential pitfall of investing. There are several terms out there that refer to this issue, such as ‘p-hacking’ and ‘factor fishing.' The core issue is that some patterns may be statistically significant, when in fact there is no real or often transitory connection to the underlying phenomenon.
Apart from regular market beta, you can explore the relationship between a stock's return and things like yield curve beta and other classic factors of value, size, profitability, and investment. This may provide a better understanding of sensitivity for specific stock profiles like growth versus value to a changing interest rate environment. You could also regress the yield curve changes on other factors using Dataiku visual ML to check for multicollinearity between the right hand side variable using metrics like R-squared.
There are obviously highly non-linear events like volatility jumps, which require ML techniques like neural nets to help identify stocks whose prices will experience jumps in volatility. Using a dataset that includes a target variable (low volatility over horizon X=y/n) which is binary as well as input variables that could affect a stock’s volatility, including measures of the stocks’ historic beta, volatility, distress risk, dividend risk, and excessive valuation. Dataiku offers visual ML for deep learning and code recipes for model building via a code-based interface.
Multinational companies all over the world, such as Standard Chartered Bank, Mercedes-Benz, and Royal Bank of Canada, are increasingly transitioning their processes from spreadsheets to Dataiku. The teams, therefore, are not only more productive, but they also get more people to use data on a regular basis, driving a culture of self-service analytics.