


To understand the evaluation process described in this blog post, we need to take a step back and understand what a hyperparameter in machine learning is. A hyperparameter is a parameter of the model whose value is set before the learning process begins. Finding the optimal values for the hyperparameters of deep models has been long considered “more an art than a science” and relied mainly on trial and error.

The learning rate is a hyperparameter that controls how much we are adjusting the weights of our network with respect to the loss gradient. It measures how much a model can “learn” from a new mini-batch of training data, meaning how much we update the model weights with information coming from each new mini-batch. The higher the learning rate, the bigger the steps we take along the trajectory to the minimum of the loss function, where the best model parameters are.
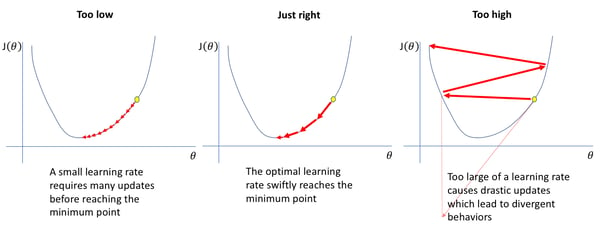
Image source: https://www.jeremyjordan.me/nn-learning-rate/
In the image above, you can see that learning rates can affect the navigation through the loss function during the deep neural networks optimization process. Indeed, one of the many challenges in training deep neural networks has historically been the selection of a good learning rate — that’s where the Learning Rate Range Test (LRRT) comes in. The LRRT was proposed in 2015 and made popular by the fast.ai’s deep learning library as the Learning Rate Finder, also known as the LRFinder. In this post, we evaluate the reliability and usefulness of this technique.
Inside the Learning Rate Range Test
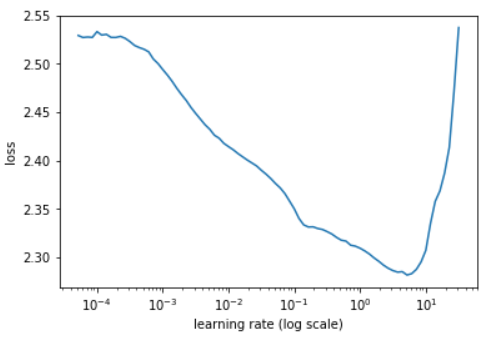
The LRRT consists of, at most, one epoch of training iterations, where the learning rate is increased at every mini-batch of data. During the process, the learning rate goes from a very small value to a very large value (i.e. from 1e-7 to 100), causing the training loss to start with a plateau, descend to some minimum value, and eventually explode. This typical behavior can be displayed on a plot (like in the image below) and used to select an appropriate range for the learning rate, specifically in the region where the loss is decreasing.
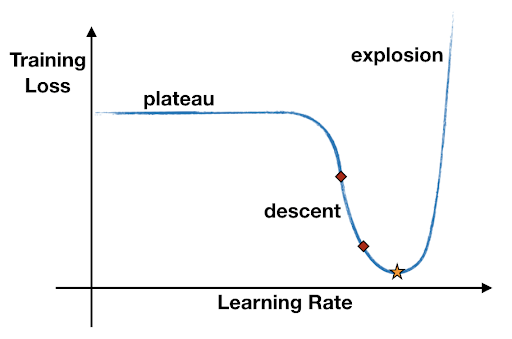
The recommended minimum learning rate is the value where the loss decreases the fastest (minimum negative gradient), while the recommended maximum learning rate is 10 times less than the learning rate where the loss is minimum. Why not just the very minimum of the loss? Why 10 times less? Because what we actually plot is a smoothed version of the loss, and taking the learning rate corresponding to the minimum loss is likely to be too large and make the loss diverge during training.
Let’s start with reproducing one of the experiments that fast.ai published in this notebook and presented in this blog post. The experiment trains a ResNet-56 on the CIFAR-10 dataset with batch size of 512 and optimizer Stochastic Gradient Descent (SGD) with momentum. We perform the same experiment using both fast.ai LRRT implementation and a Keras implementation.
The Role of Initialization
One first striking observation in using the LRFinder is that the loss can be quite different as we change the initial weights of the model.
We perform 20 runs of the LRFinder, changing the initial weights by means of the he_uniform initialization (called kaiming_uniform in PyTorch and fast.ai) every time. The median smoothed loss and recommended range, as well as the 10% and 90% quantiles of both the loss and the range values, are displayed below for Keras and fast.ai.
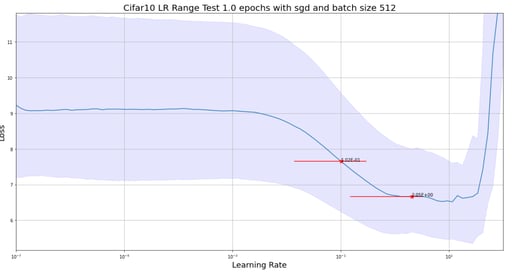
The LRRT results on 20 runs with different initial weights using Keras.
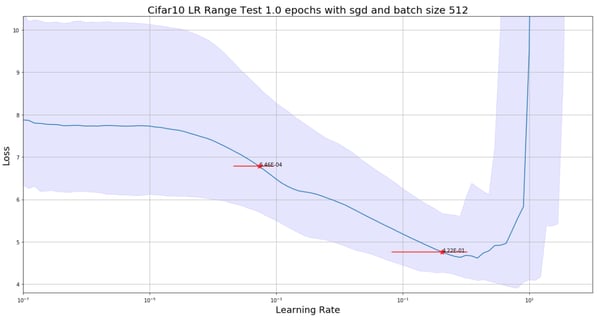
The LRRT results on 20 runs with different initial weights using fast.ai.
Although the median values of the suggested learning rate range (0.1, 2.) are of the same order of what was published by fast.ai (0.08, 3.), seen in the image below, we found lower suggested learning rates with the current fast.ai implementation (5e-4, 0.4).
Because of the large variation of the LRFinder plots, it might happen that for a different weight initialization, we arrive at different conclusions. For instance, for two different weight initializations, say A and B, we get different non-overlapping suggested ranges, as shown in the image below.
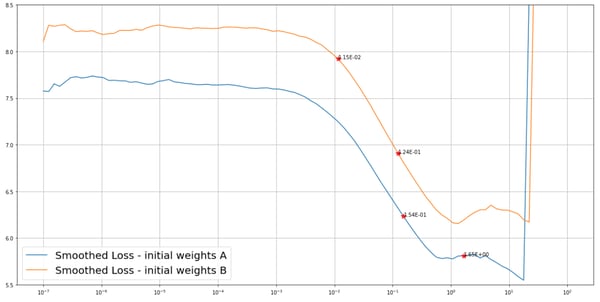
In this case, if we use the maximum learning rate of the model with initial weights A to train the model with initial weights B, it is likely that this learning rate would make the loss diverge. Actually doing so leads the model to overfit. One important recommendation, then, is to use the same initial weights for the LRFinder and the subsequent model training.
So, Is LRFinder Truly Reliable?
Although we can produce similar results to fast.ai in the LRFinder experiments, such high suggested learning rates are quite different from what is used in state-of-the-art contexts to actually train similar models with SGD. The LRFinder recommends a maximum learning rate of 2.0, while the usual value is around 0.1.
Furthermore, if we look at the unsmoothed training and validation loss during the LRRT displayed in the image below, it doesn’t seem safe to use such large learning rates. The smoothing applied might be masking the actual behavior of the training loss in the rightmost region of the plot, where it becomes unstable due to the high learning rates. Note that displaying the validation loss requires running a full validation at every batch, making the LRRT impractical, as it would take much longer to run (1.5 vs. 50 minutes on a GTX 970 GPU in this case).
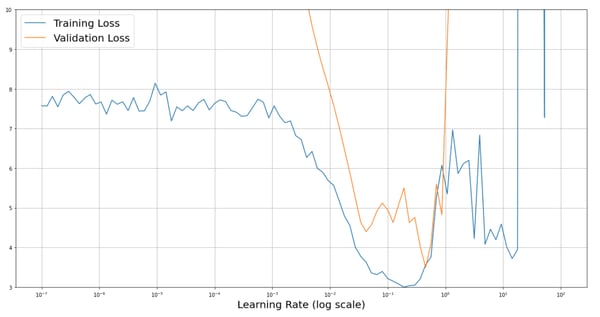
On the other hand, selecting the minimum learning rate as the one where the loss has the steepest descent seems reasonable and safe. The LRFinder is then a useful tool to automatically select a sensible learning rate for an arbitrary model.
The LRFinder confirms a common deep learning practice that, for a larger batch size, we should pick a higher learning rate, as illustrated in the image below. The intuition behind this practice is that, with a larger batch size, we are using more data and getting more accurate estimates of the gradients for a single weights update.
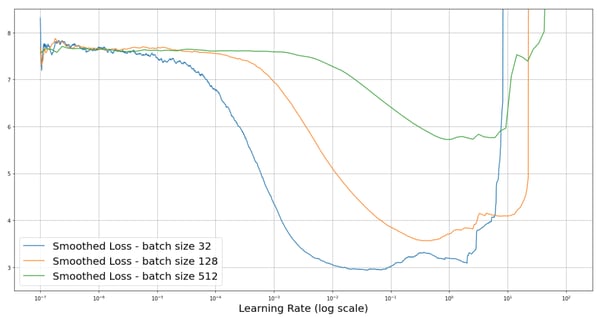
For this reason, we can use a higher learning rate so we can be more confident about the estimated direction of the loss descent. Note that the curves in the image seem to suggest that the loss decreases less when increasing the batch size, but this is merely an effect of the smoothing.
The LRFinder is a useful tool to receive a recommended learning rate to use for a specific setting, but it must be used with some caution. It is essential to set the same initial weights in the LRRT and in the subsequent model training. We should never assume that the found learning rates are the best for any model initialization.
Further, setting a narrower range than what is recommended is safer and could reduce the risk of divergence due to very high learning rates. The use of advanced dynamic learning rate policies (such as cyclical learning rates and warm restarts) further reduces the dependency on the learning rates, and thus the risk of divergence, but that is its own separate topic. If you want to try the experiment on your own, the code to reproduce the LRRT experiments with different initial weights is available in this repository.