


If you have ever watched a cycling race, you’ve probably felt that sense of uncertainty, the excitement of not knowing whether the "echappée" will make it to the end or not. The thing is, as a data scientist, I cannot help but wonder: how much of the Tour de France can we predict?
*Note: This project was done in an older version of Dataiku. Though the functionalities are the same, the screenshots look a bit different. To see the latest version of Dataiku in action, check out the on-demand demo.
If the road is still long before we can predict the winners of each stage, there are plenty of fun data preparation and data visualization things we can do with the data from previous Tour de France. And with the help of Dataiku, we will see how easy it is to cluster Tour de France’s riders!
Sports Analytics: The Revenge of the Nerds
Perhaps it is because baseball is a very slow-paced game that so many statistics have been developed around it. After all, trying to quantify how good a player or a team is keeps the sport commentators talking, and that’s a good thing when things get a little slow.
This was taken to a whole different level when data-oriented people (i.e., nerds) entered the game. It wasn’t long before sabermetric, the field of empirical analysis of baseball, was born. And with sabermetrics came loads of sophisticated stats whose acronyms are as mysterious as they are poetic (BABIP, OPS, LIPS, DIPS, and my favorite, NERD)
Other major American sports, like football or basketball, quickly started to develop their own analytics systems, and there is now a constant flow of new stats (like the real plus minus, created by ESPN for basketball).
Hollywood even caught up with the trend with the movie Moneyball, relating the sabermetric approach of the Oakland Athletics baseball team’s manager Billy Beane in order to assemble a competitive team.
Moneyball, the movie
If some sports are not as big on statistics as baseball, it is perhaps because it is harder to collect meaningful data. But this is not quite the case with cycling: we can easily have access to the speed of each rider as well as the weather and geographic conditions for each stage. This should be enough to get us started - let’s try.
Data Collection and Preparation
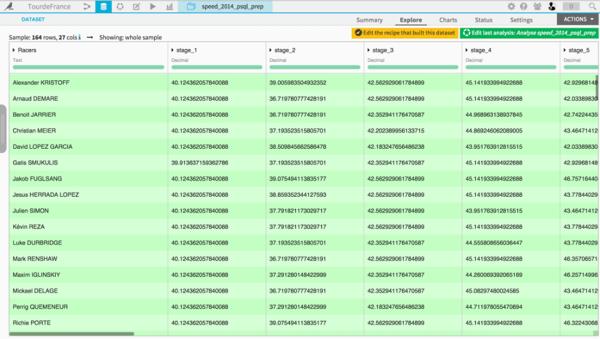
For now, let’s focus on easily accessible data. We won’t take into account the weather conditions or the varieties of landscape of particular stages, but we will take into account the racers’ speeds at each stage of the previous Tour de France.
After a quick web scraping, I have uploaded them to Dataiku:
I’ve classified all the stages as belonging to one of the following categories: Flat Stage, Medium-Mountain Stage, Mountain Stage, Individual Time Trial, and Team Time Trial
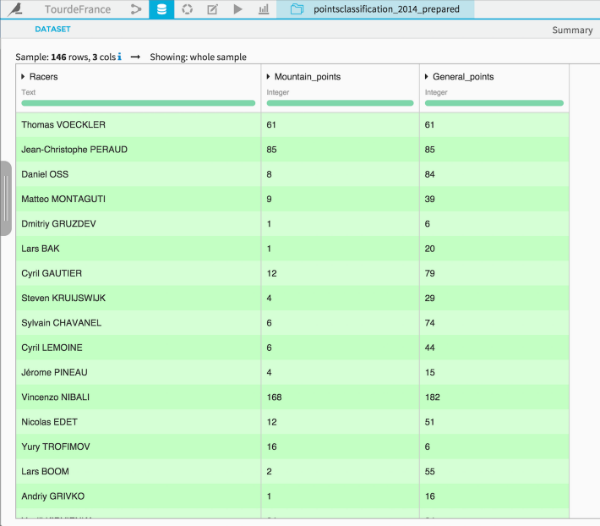
As in many multi-day races, there are also two secondary classifications: the general points classification and the mountains classification. For the point classification, points are awarded for winning intermediate sprints and for the first 15 riders of each stage. This points classification rewards the most consistent riders (and is often a sprinter). And as the name suggests, the mountain classification awards points to the cyclist that reaches the mountain top first. I have also added the data corresponding to those two classifications to Dataiku.
After joining those two datasets, you can easily run different clustering algorithms (like a K-means or a ward hierarchical clustering) and choose the one that gives the best results while also being easily interpretable.
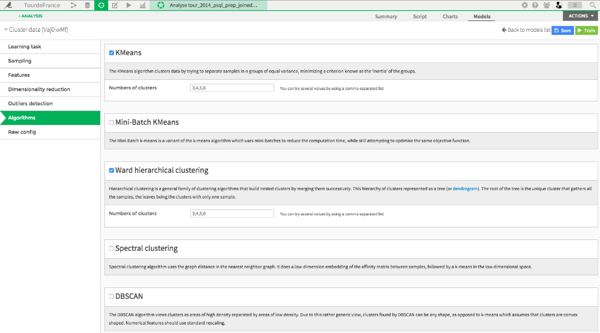
I have chosen a standard 5-means algorithm. The nice thing with playing with this dataset is that we can have a peak at each cluster and see its riders. But this is clearly cheating, so let’s do it the proper way.
Dataiku Finds the Clusters, Your Only Job Is to Label Them!
There are many things we can ask Dataiku to do for us, but we still have to inspect the clusters ourselves if we wish to interpret and label them correctly. This is, without any surprise, what took me the most time!
Interestingly, the algorithm has detected one outlier. It appears to be Cheng Ji, of course! He is the first Chinese rider to complete the Tour de France, finishing as the "lanterne rouge," i.e., the last position…only 50 minutes after the rider that arrived just before him.
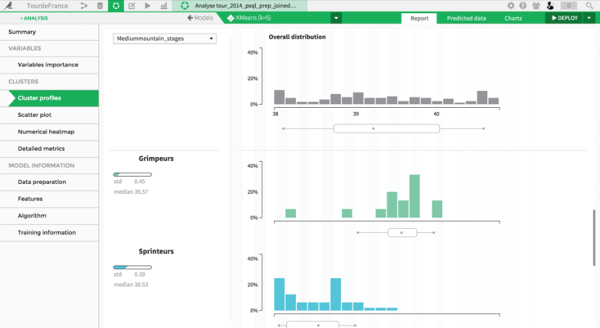
Thankfully, we can explore the cluster profiles to better understand how each cluster is made and name them accordingly:
To analyze the clusters, we can also look at a scatter plot projection on different features.
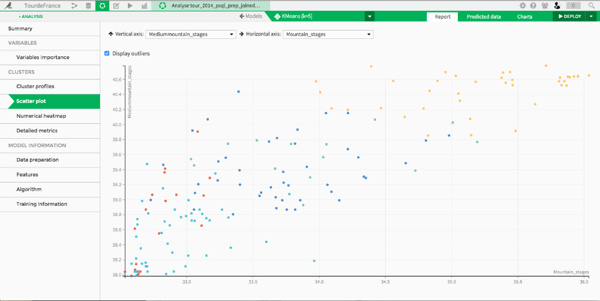
The cluster in yellow detaches itself pretty clearly. After a quick inspection, we see that it is made of the best riders of the Tour de France: this is the "All-stars" cluster where we find the top 20 with Alejandro Valverde, Thibaut Pinot and of course the winner of the Tour de France 2014, Vincenzo Nibali. Dataiku is so insightful that it automatically colored this cluster yellow. Hard to ask for more, right ?
We also find clusters corresponding to "Grimpeurs," "Sprinteurs," and "Rouleurs-Puncheurs" (this basically corresponds to riders who are experts in rolling parcours). One cluster remains to be named that seems hard to distinguish from the Sprinteurs and the Rouleurs-Puncheurs. It turns out it is composed of riders that won most of the points in the point classification.
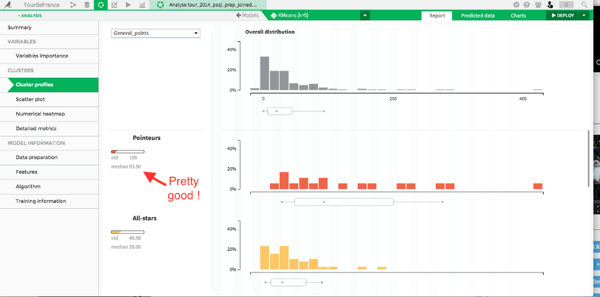
They are points-seekers, and they deserve their own French name: they are the "Pointeurs."
Toward Our Next Model
The 2015 edition of the Tour de France will give access for the first time to enriched data with real-time speed and position of each rider in the race. As soon as I find a way get my hands on that data, I will upgrade our model, so stay tuned for another take on the Tour de France with Dataiku. (Oh and by the way, the cycling fan in me is pretty sure Nairo Quintana is going to win this one).