


Predicting the number and even the type of crimes that are committed in the Greater London area each month is no easy task, but here’s how I cracked it using Dataiku. This blog post was updated in February 2017 to include comprehensive 2016 data and produce machine learning crime predictions for 2017.
An Introduction to Machine Learning Crime Prediction
In 2014, London police started trialing software designed by Accenture to identify gang members that were likely to commit violent crimes or reoffend. It began an unprecedented study drawing on five years of data that included previous crime rates and social media activity. Using data to fight crime is clearly not entirely novel, but I wanted to take this further, especially with all the open data about crime that is available.
The Greater London police groups (Metropolitan and London) are doing a great job at fighting crime, providing data, and mapping the results, but what’s interesting is to try to make machine learning crime predictions and not just have a view on the past data.
We might already have an idea of who is likely to commit a crime, but how many crimes would this result in, and what would be the nature of these crimes? This was the kind of information I hoped to predict, so I tried two different predictive models: crime month-by-month at the LSOA level and crime type (whether burglary, bicycle theft, arson, etc.) month-by-month at the LSOA level. LSOA is a census area containing 1,000 to 3,000 people. Here’s the full definition from ONS.
Below, I've compiled a step-by-step guide to building the machine learning crime prediction project, inclusive of the details for your reference.
1. Inputting and Enriching the Data
So, where to begin? I sourced the data from the open source crime database on the U.K. police portal, selecting data from 2011 to 2016 pertaining to Greater London (central London and the surrounding metropolitan area).
The main source of data I used is available here — I selected the metropolitan and London areas. I also used U.K. census information, Point of Interests (POIs), and the geographical locations of police stations.
I enriched the dataset with various open data sources, added the police station coordinates, added post codes, and inputted POIs and the LSOA statistics.
2. Building the Dataset
To prepare the dataset for training the machine learning models, I created a geohash based on latitude and longitude coordinates. I cleaned the data for recoding by filling empty values and structuring, which is super simple in Dataiku.
I then created clusters for the LSOA in order to define the criminality profiles and their levels and found three clusters and one outlier. The different datasets could then be joined.
3. Building the Predictive Models
I built two models, the first for prediction per LSOA per month and the second for prediction per LSOA per month per crime type.

4. Blending the Data
I collected the POIs, cleaned the data, and created a geohash for each latitude/longitude coordinate, and then loaded it into a HPE Vertica database. Then, I was ready to collect the crimes from 2011 to 2016 and to clean this data.
Here is an overview of the first data preparation step:

I have developed a geohashing plugin for transforming the XY coordinates into categorical values. If you are not familiar with Dataiku plugins, you can find out more here. Plugins are super useful for packaging a methodology and adding new functions to Dataiku.
Let’s have a first look at the volume of crime data we collected. For this, I created a chart of the number of crimes by year with Dataiku:
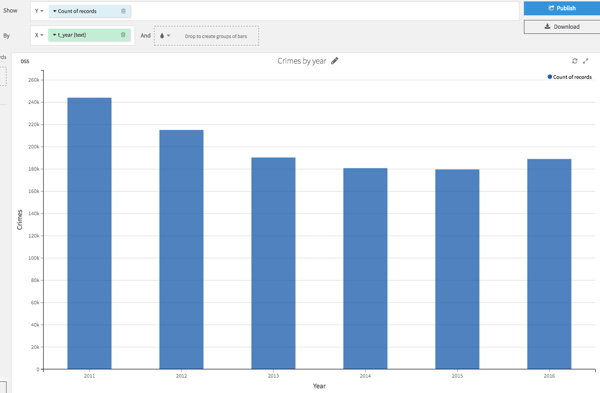
I decided to work with crime data from 2012 to 2015 and then make machine learning crime predictions for 2016. The second step was to predict the number of crimes in 2017 based on the 2016 model. The first pleasant surprise was seeing the number of crimes decreasing, but I was less surprised by the re-categorization of crimes. This is often the case in other industries when, for operational reasons, a category is split or merged. I decided to regroup some crimes to give more stability to the approach:
 Regarding the POIs, let’s focus on the POI "subcategory," which is consistent and detailed enough for our predictive model:

Here’s a sample of the police stations that I collected:

I then collected the census statistics for each LSOA, added the police station directory, defined a geohash, processed the number of police stations per LSOA, and added restaurants to the POIs that had previously been added.

Next, I created an LSOA clustering model. I tried to cluster the LSOA regarding crime level and type. In Dataiku, you can set and assess different algorithms in order to ensure the best performing one; I selected a K-Means with the best silhouette score.

5. Iterating the Predictive Models
I created three predictive models with the visual-guided machine learning of Dataiku.
- Number of crimes at the LSOA level for each month.
- Number of crimes per LSOA and type of crimes for each month.
- Number of crimes per LSOA per type of crimes.
Here are the results for the crime prediction at the LSOA level for each month, please feel free to contact me if you want the other models! Regarding the key metric R2, I decided to not tweak the parameters or re-engineer the features with a custom code.
Here is the debriefing:

Let’s look at the variable importance:
The most contributive feature was obviously the LSOA size area (but this is a good feature). Then comes the average number of crimes of the past four years, the average distance to the city center, etc. If we look at the relationship in more detail, it seems that there is generally a higher level of crime in the center which is probably due to the concentration of shops, tourist attractions, pubs, etc. However, that’s not the only explicative feature.

Dataiku provides useful debriefing reports like the one below. Our error distribution is pretty good for a first model! Keep in mind that the model is slightly underestimating the number of crimes (distribution on the left).

The Pearson coefficient gives the global correlation between the observed crimes in 2016 and the predictions.

6. Deploying the Predictive Models
I applied the predictive models to the 2016 data. For example, where 19 crimes were observed for the E01000001 area in January 2016, the model predicted 19.24. Below, we have the real data to the far left and the predicted data to the far right:

Here is an overview of the two final output datasets :


7. Analyze the Results
I was expecting a direct relationship between the number of shops, restaurants, tourist attractions, etc. and the number of crimes committed, so I wasn’t surprised to see that the density of POIs correlated in part with a higher number of crimes.
Here’s a data visualization that offers a clearer explanation of the link between POIs and the number of crimes:

So what was I surprised by? Well, creating performing predictive models with a basic dataset proved remarkably straightforward and didn’t require a huge amount of work! What’s more, I’ve shown that anyone can use open data sources to build predictive models for valuable causes such as crime prediction in just a few hours, provided they have the right tools. You don’t have to be an expert to do this!
2017 Predictions
It’s time to apply our model to the data from 2013 to 2016 and discover the predictions. Keep in mind that this model is mainly built with trends and POIs. As a result, I don’t have control over the predictions. In other words, if something changes significantly in the police strategy, law, areas, etc… the model could be completely wrong.
For the LSOA E01000001, the crime was 19 in January 2016 and expected to be 20 in January 2017. Let's remind ourselves that the model is slightly underestimating the number of crimes. In this area in 2016, 268 crimes happened and we forecasted 248.

Visual Overview of the Predictions
Let’s take the crime data and the predictions and put it in an ArcGIS Online map (London crime prediction map) and create a Web application (Dataiku is an Esri Silver Partner). The chart below shows the number of crimes predicted for 2017 per LSOA centroid.
It is no surprise that this density map highlights the city centre. The bubble size represents the volume of crimes and the color is the percentage change 2017 vs. 2016. There is no specific increase for the area with the highest number of crimes.


Here's a reminder of the initial map with 2016 January to August data on LSOA Polygons:

As LSOA is an ONS statistical unity, it is never easy to figure out the correspondence between an LSOA and a real neighbor. Let’s focus on the LSOA with the highest level of crime. By setting a high transparency on the map, we can see that the highest number of crimes are in an area crossing Soho, Leicester Square, and Charing Cross.
This is the initial map with the 2016 January to August data:

Let’s draw the crime prediction distribution by LSOA name in Dataiku — the "Westminster 018A" is the LSOA with the largest number of crimes. This LSOA is roughly crossing Leicester Square and Charing Cross (on the initial map with 2016 January to August data).

Finally, let’s map the Residuals’ Standard deviation (residual means the difference between predicted and actual values). This will give us an idea of the model fitting regarding the geographical dimension and can help improve our model quality. Colors are residual values for 2016 and the size is the absolute value.

We can see that our model has a bigger deviation on specific areas, especially when approaching the city center, probably because we are mainly taking into account the trends and not enough event data.
What's Next?
To improve the approach and goals, we also need to create a predictive model at a lower area for a shorter time frame. Adding some newsfeeds would also enable us to detect results that are related to certain trends. We could also envisage improving this performance by using other kinds of algorithms and machine learning approaches.