This year, organizations are determined to execute on data science and AI strategies that are agile, collaborative, and responsible, in order to ultimately achieve concrete business transformation. Our Dataiku super users have been busy exploring new possibilities with the platform, pushing forward to solve business problems and deliver solutions to their respective organizations. Before our next release, brush up on top features when it comes to visualization, efficiency, and transparency, and see how you can leverage them with ease. You’ll be on the road to becoming a super user in no time!
Flow Guru
The Dataiku Flow is the visual grammar for data science, so users can quickly understand a data pipeline through the flow. This is where users can visualize the datasets, connections to databases, visual recipes for transformations, machine learning, code, and plugins. Here are four key Flow capabilities that our super users think have been the most helpful (and will continue to be in 2021):
1. Schema Propagation

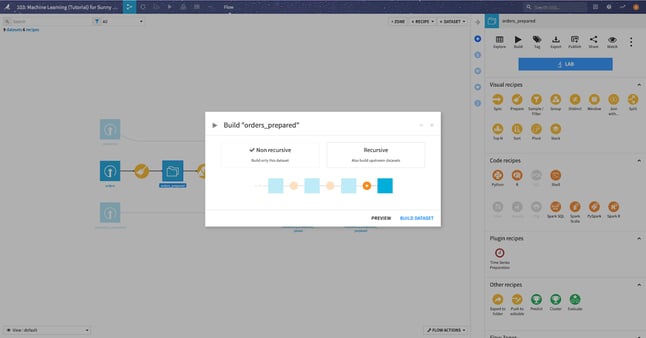
When you make changes to recipes within a Flow in Dataiku, or new data arrives in your source datasets, you will want to rebuild datasets to reflect these changes. Schema changes can result from changes to the columns in the source data or because you have made changes to the recipe that creates the dataset. Schema propagation in the Dataiku Flow automatically propagates changes to a dataset's columns to all downstream datasets.
2. Activity Views

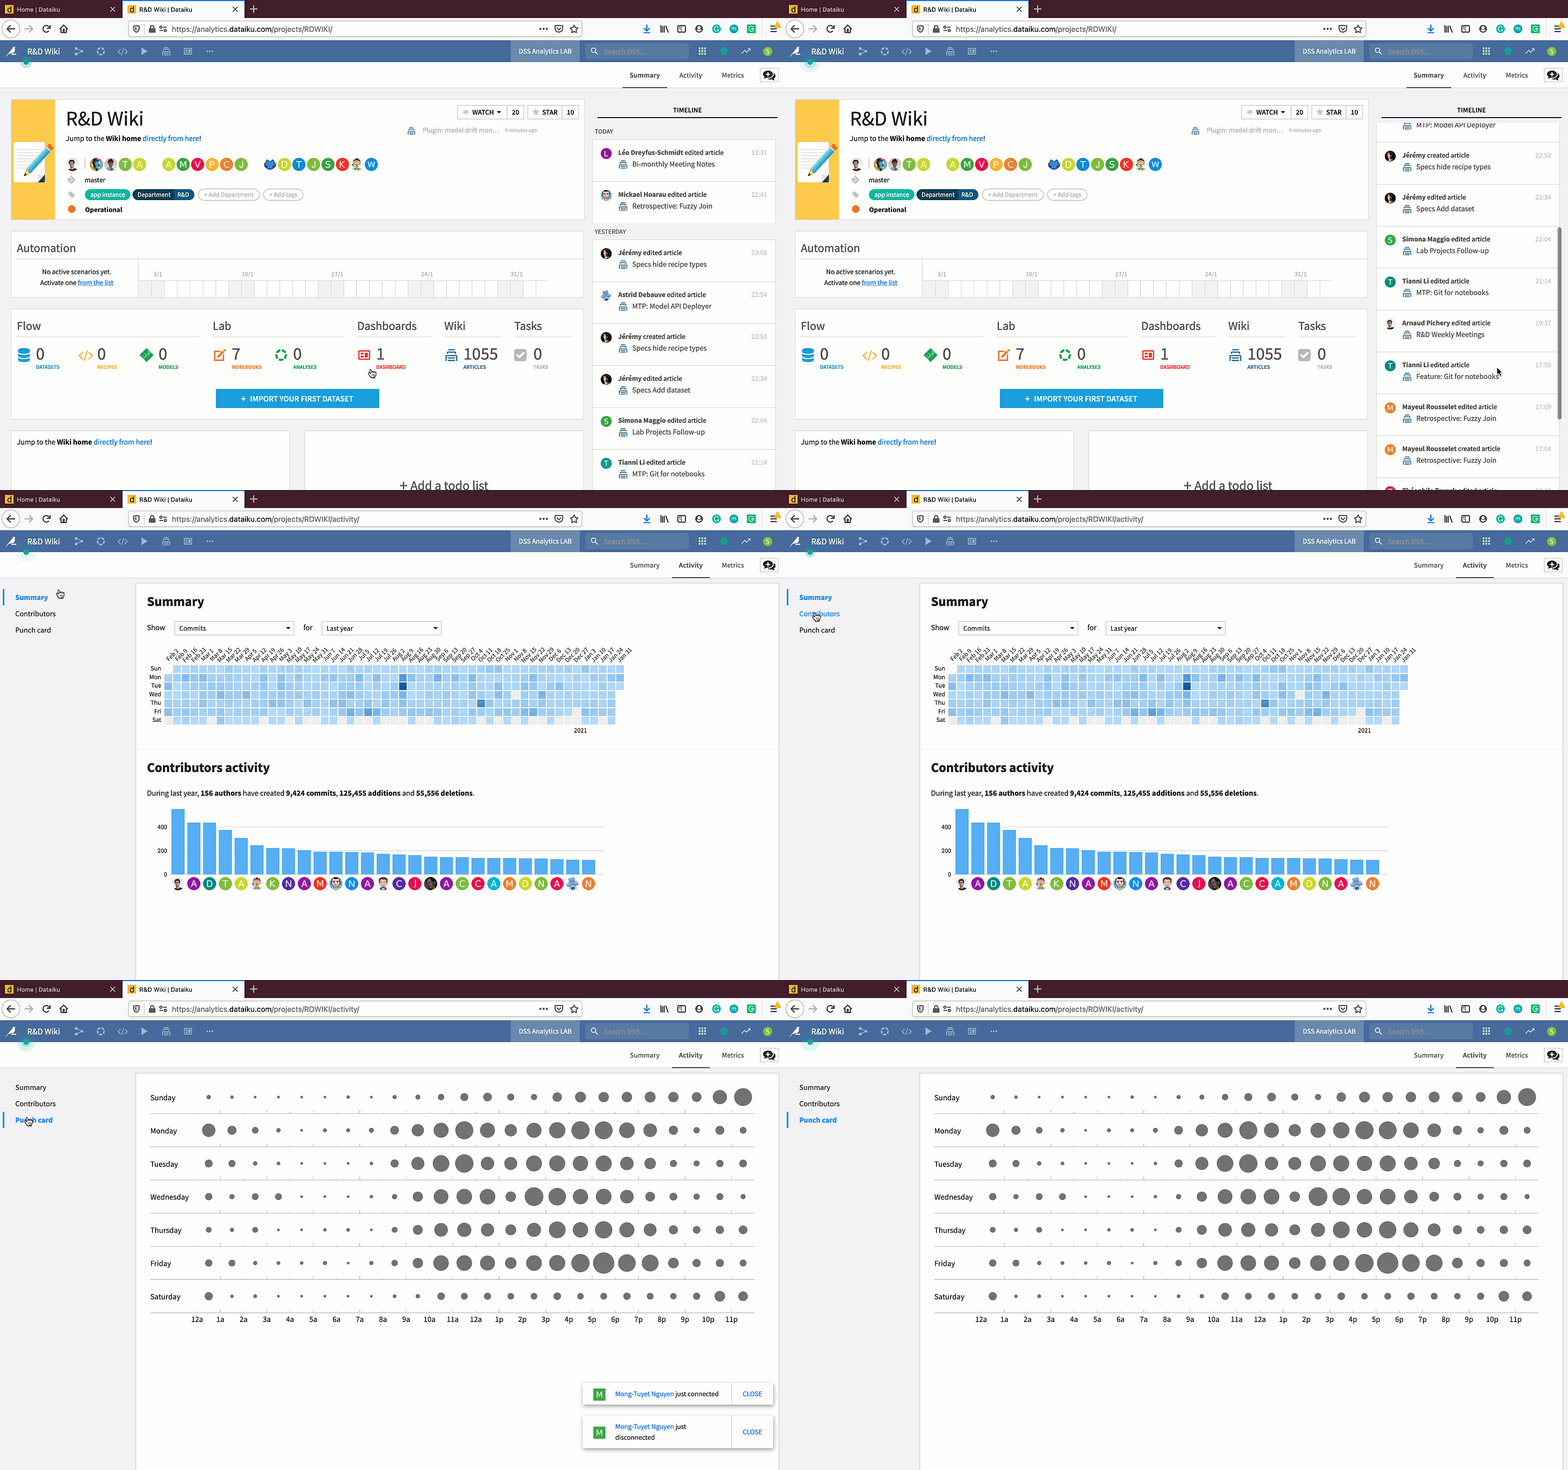
Activity views in the Dataiku flow show collaboration on a complex Flow in a compelling way. You can easily visualize when and by whom a change was made to any element of the Dataiku Flow and filter on parameters like last modification, Creation (user), scenarios, and more.
3. Application-as-Recipe
With Applications-as-Recipes, you can package an entire Flow into a reusable visual recipe in a single click. This gives your team a jump start for common or niche use cases without having to code a plugin. Learn more in our tutorial and in the reference documentation.
4. Flow Zones
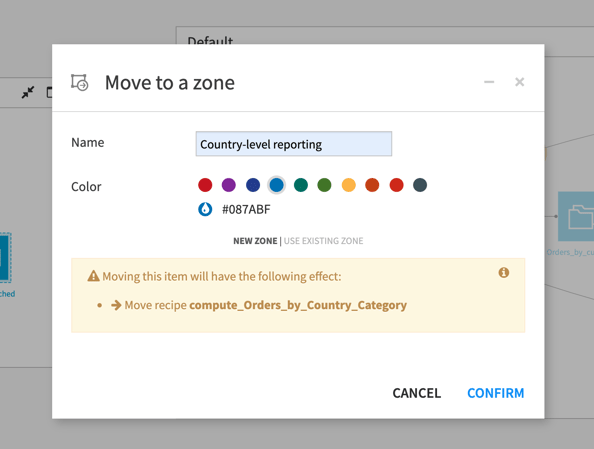
 Even a simple analysis can lead to a complex, long Flow that can be hard to read and navigate. To better manage large projects, you can divide the flow into zones by assigning each dataset, recipe, etc., to a zone. The zones are automatically laid out in a graph, and you can collapse each zone for a simplified view of the flow. You can color code, name it for easier navigation, and quickly move to different zones. Learn more in the reference documentation.
Efficiency
Work smarter not harder! Everyone wants to be more effective and efficient at their jobs. Here are the top four ways to be more efficient from our Dataiku super users:
5. Standardize Labels With Fuzzy Values Clustering

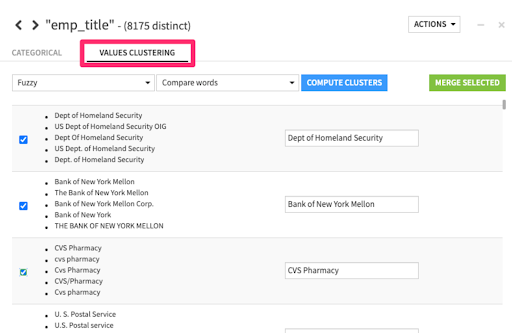
When working with large amounts of disparate, user-entered text data, we often need to standardize or collapse entries into a resolved form. Text cleaning strategies like normalization that standardize on case and remove punctuation may help in this regard, but they don't get us all the way there. Similarly, if it is user-entered data, you might not be able to introduce a rule-based strategy using regular expressions.
The solution lies in a technique called fuzzy matching — this enables you to choose a clustering strategy of "Fuzzy" or "Highly fuzzy" depending on how close you require values in the cluster to be and quickly resolve close variants in strings with a few clicks.
6. Global Tags Categories
Discoverability of specific projects, datasets, or recipes in large projects with multiple collaborators can be tricky. Global tag categories enable admins to add, remove, and manage tags easily. They are set at a global level and apply across the entire instance. This capability helps compliance teams to identify projects or objects based on their key characteristics quickly, ensures consistency and accuracy in tag naming conventions across user groups, and serves as an archive of custom metadata for future use. Learn more in the reference documentation.
7. Global Search
Dataiku provides a search bar at the top of every screen, which enables you to quickly find and navigate different types of Dataiku elements from wherever you are. Type your search term in the bar, and Dataiku begins searching for matches across several sources, including the help pages, recent items, screens and settings within the product, and the catalog. You can focus your search on particular types of items using the available filters. Once you've found what you're looking for, you can go directly to it from the search drop-down. Happy hunting!
8. Project Folders
Project folders in Dataiku help you stay organized and enable smooth collaboration. Furthermore, admins can manage user permission at the folder level allowing for easier user management.
Transparency
With great power comes great responsibility! And our super users know this better than anyone. The product team at Dataiku focused a large portion of their development efforts on helping organizations feel confident with transparent and explainable AI in 2020. Here are four key Dataiku features that will move the needle on transparency and explainability:
9. Model Document Generator
Dataiku makes model documentation easy, standardizing with one template and automatically generating the necessary documentation. Kiss the hours of manual copy and paste goodbye!
The Dataiku Model Document Generator outputs a .docx file for easy collaboration with the broader organization — all you need to do is click a button once you have trained a model and inspected the results, grab a cup of joe, and voilà! The document is ready to go in a few minutes. The output document also follows a consistent, logical sequence, with clearly indexed sections, delivering a standardized framework for future reference and comparisons.
10. Individual Prediction Explanations
In Dataiku 7, we introduced individual prediction explanations (i.e., row-level explanations for why a model is producing a given prediction) as part of the Dataiku interface and as an output of the scoring recipe. With Dataiku 8, you can now programmatically obtain these row-level explanations through APIs. It’s not just for AutoML either — individual prediction explanations can be generated for models built from scratch.
Row-level interpretability helps data teams understand the decision logic or "why" a model makes specific predictions. With the global movement toward more stringent data protection laws —requiring data teams to adhere to frameworks like the European Union General Data Protection Regulation (GDPR) and the California Consumer Privacy Act, (CCPA) — individual prediction explanations ensure compliance and explainability of complex machine learning predictions for hassle-free governance.
11. Subpopulation Analysis
Subpopulation analysis in Dataiku helps you visually assess if your model behaves identically across different subpopulations. This helps users create less biased models and avoid unintended model biases before deploying a model into production. Additionally, subpopulation analysis can help users to compare and improve model performance on specific sub-populations.
12. Model Drift Monitoring
Monitoring ML models in production is often a tedious task. You can apply a simple retraining strategy based on monitoring the model’s performance: if your AUC drops by a given percentage, retrain. Although accurate, this approach requires you to obtain the ground truth for your predictions, which is not always fast, and certainly not “real-time.”
Instead of waiting for the ground truth, Dataiku’s Model Drift Monitoring plugin looks at the recent data the model has scored, and statistically compares it with the data on which the model was evaluated in the training phase. If these datasets are too different, the model may need to be retrained. And that wraps it up! We hope you found this roundup helpful as you explore new ways to take your data science and machine learning projects to the next level in 2021.


