A few months ago, Benjamin Thomas, an Innovation Consultant at Wax Interactive and a marketing professor, decided to introduce the concepts of data preparation and data science to his students. For his class, he chose to use Dataiku DSS.
Read about Benjamin's experience in this blog post and try Dataiku for yourself, or check out one of the other cool projects we've done with Dataiku using open-source data.
My name is Benjamin and today I work for a digital agency called Wax Interactive. I also happen to teach Marketing & Innovation at CESACOM, a school for communications. My students are in their fifth year (French equivalent of a Master’s second year). Among other things, it is my job to give them an understanding of the basics of data analysis. The goal is not to make data scientists out of them since they do not have the slightest statistics or DB specialist background, but rather to give them the basic understanding of what data science encompasses.
When time came to prepare the lesson, I struggled with how to get them to really understand basics of data analysis in two hours. I decided that in order to do so, rather than delving into pure theory, I’d have them face a real-life problem. But for this I needed data.
I first thought of using the big Excel files I used to work on when I was marketing data analyst for Tesco. But that was long ago, and those Excel files were long gone. Then Dataiku DSS came to mind. Ever since we successfully worked together on a mission for a banking client, we had stayed in touch. I decided to ask the team if they could help, and as they always do, they gave me a hand.
Revenue Prediction With DSS

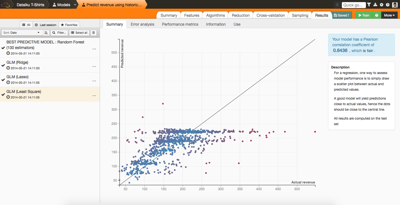
A few hours later, Dataiku gave me access to a demo platform on which I found a demo mission of a real-life example. When I clicked on the demo mission, not only did I find instructions for a real problem to solve (“how to sell more t-shirts by predicting which customers will generate the most revenue?”) but also this fictitious e-commerce t-shirt retailer’s data (web logs, user data, etc). Great — I had all I needed to demonstrate what a data project looks like and how data scientists use raw data to create data driven applications.
When the class began, I went for a round of “raise your hand if you know some basics of statistics?” Typical sleepy early morning “no reaction.” So I went on telling them we would look at a real-life case, the business of selling tees. Lucky me, some of the students were working on a side project that was, low and behold, an online t-shirt store. I had their ears. Then Dataiku unveiled its magic: simple, clear interface, and easy to understand visuals. Suddenly, the steps from preparing data to applying predictive analytics felt tangible to the class.
Reviews (yes, teachers get reviewed on a regular basis) were really amazing. The students mentioned being surprised that something they thought was just “boring math” actually took form and helped tackle real-life problems. I felt I had done the job: they would probably not turn out to be data scientists, but next time they would be faced with a data issue, they would know where to look (and who knows, they may very well recommend Dataiku to their boss.)


