


This blog post walks through a simple use case in Dataiku: social media analysis. For my first word cloud, I decided to use the RER A (regional Parisian train) Twitter stream. Why? Because if there is one place on social media where you can be sure to find strong emotional words, it's definitely on public transportation Twitter streams.
** Note: This analysis was done (and screenshots taken) in an old version of Dataiku. Visit Dataiku Academy to see an updated tutorial on building webapps in the latest version.
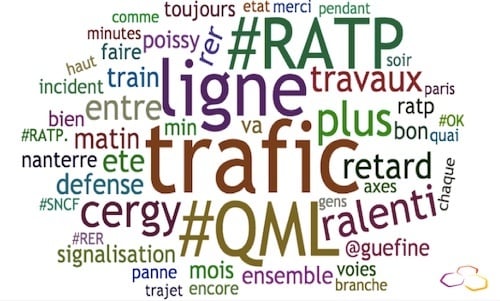
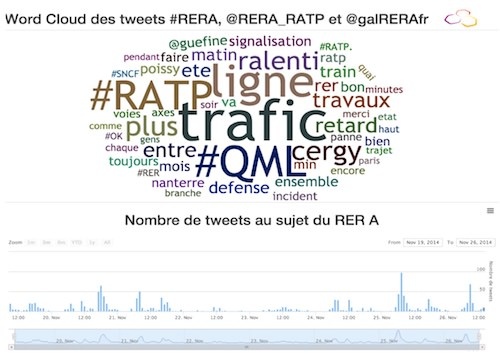
On November 19, I started scrapping RER A's mentions on Twitter. In 10 days, I'd gathered approximately 1,500 Tweets. The word cloud I created shows the 50 most tweeted words for #RERA, #RERA_RATP, @galeRERAfr. As expected, most of the words refer to slow traffic and delays. It is also interesting to note that the station names that appear the most (e.g., Cergy, Poissy, Nanterre, La Défense), are those on the western end of the RER A.
These results immediately intrigued me. Was this word cloud giving me noteworthy information on RER A's tendency for delays, or was it hinting at the simple fact that people Tweet more when they are upset? I decided to dig a little deeper. Below, you’ll find two graphs showing Tweet activity. The first shows the variations of Tweet activity per day, and the second shows Tweet activity per hour.
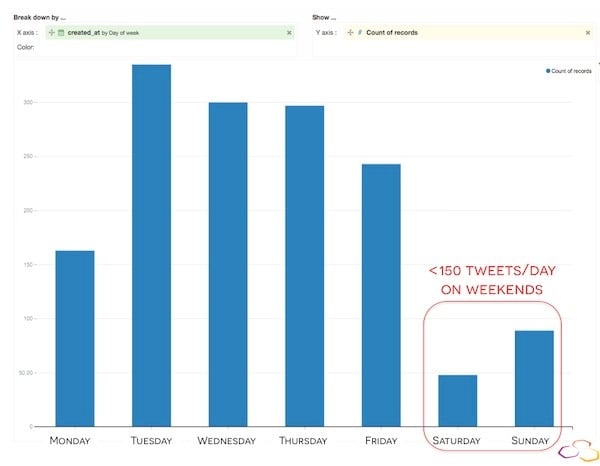
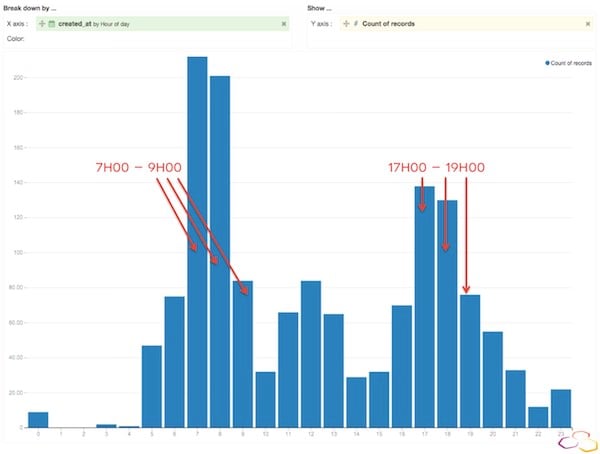
According to these visual representations of Tweet activity, people Tweet the most about RER A Monday through Friday between 7am - 10am and 5pm - 7pm. From this information, I can safely conclude that people tweet while they are going or coming from work/home, i.e., when they are in or near the RER A. Let’s dig a little deeper. Here is graph of the number of tweets per hour:
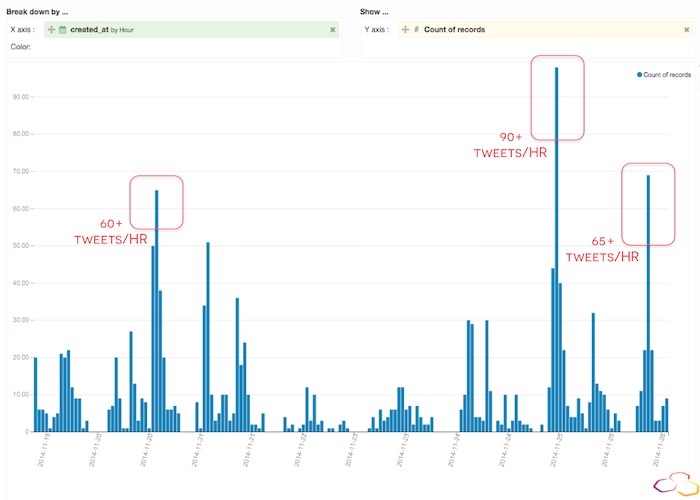
When I first generated this graph I noticed some extreme peaks in activity at seemingly random times. Because these peaks didn't seem to follow a particular pattern (besides morning and evening typical increases in activity), I assumed that they reflected isolated incidents. To be sure, I used Dataiku to build an interactive webapp that would let me zoom into specific time periods in the "Tweets/hour" graph and immediately see the associated word cloud:
To validate my hypothesis about incidents and Tweet volume correlation, I used the webapp to zoom into the morning of November 25th when almost 100 tweets were published in under an hour.
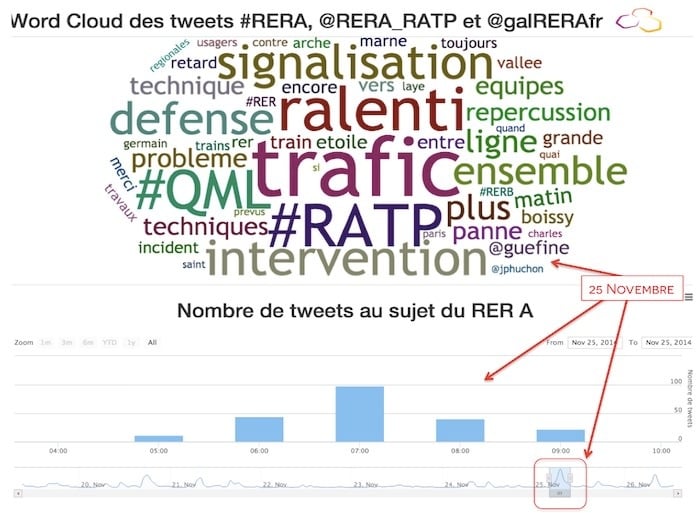
As I had guessed, during the November 25th Tweet peak, people's comments were negatively connoted and seemed to reflect a traffic or technical incident: "ralenti" (=slowed), "trafic." "intervention," "repercussion," "defense," "technique," etc. To be sure this wasn't just a coincidence, I decided to compare this word cloud with that of November 24th, a day on which users only generated 163 tweets (equivalent to the number of Tweets generated in only 2 hours on the 25th).
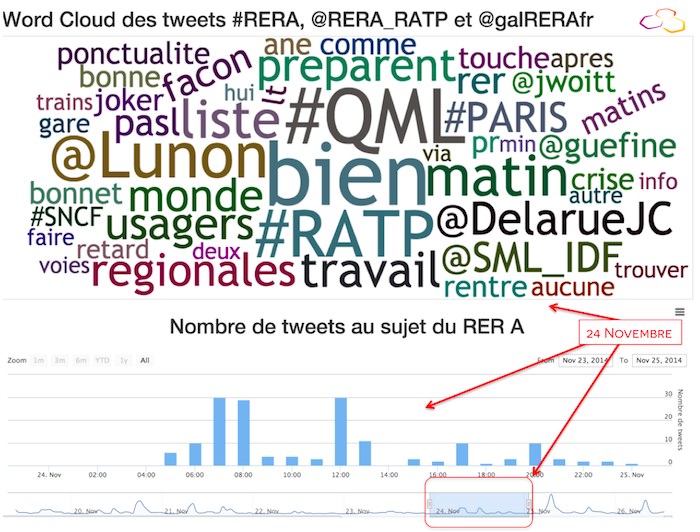
Sure enough, in this word cloud, the most recurring words are generally positive: “bien” (good), “ponctualité” (punctuality), “bonne” (feminine form of good), etc. Furthermore, in this word cloud, it is hard to pinpoint one underlying subject matter or theme.
My conclusions from this first RER Line A Twitter Triggers investigation is three-fold:
- People tweet about RER A traffic conditions when they are not happy; with more data, we'll see if this unhappiness is regular or specific.
- Tweet activity in volume (regardless of content) is a telling indicator of traffic conditions.
- Building a webapp with Dataiku is fun and pretty easy, and it's not just for data scientists!