I joined Dataiku this week as their first New York based hire. In order to get more familiar with Dataiku DSS, I used it in a machine learning competition, the Kaggle West Nile Virus competition, which I will describe for you in this blog post.
Heads Up!
This blog post is about an older version of Dataiku. See the release notes for the latest version.
Kaggle recently launched the Kaggle West Nile Virus Competition. All of my previous data science projects were done directly in R, Python, or Julia. With Dataiku DSS, I was impressed by the fact that I didn’t lose flexibility, and actually felt like I was working faster and increasingly able to focus on making the important decisions. In addition, I really liked having a visible and easily reproducible workflow.
Competition Overview
Chicago mosquitos sometimes have the West Nile Virus. The goal here is to build a model to better predict when and where in Chicago captured mosquitos will have the West Nile Virus.
There are three different datasets:
-Mosquito trap data: Location of traps, how many mosquitos on which date, and whether they have the West Nile Virus
-Weather data: Two Chicago weather station reports with many indicators (temperature, dew point, sunset, and so on)
-Spray data: GIS data for insecticide spraying by the city
Import and Clean the Data
The datasets were compressed .CSV files which can be directly imported into the application.
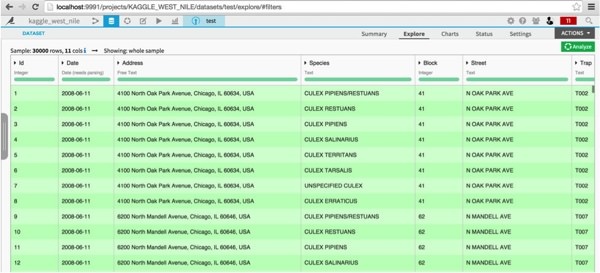
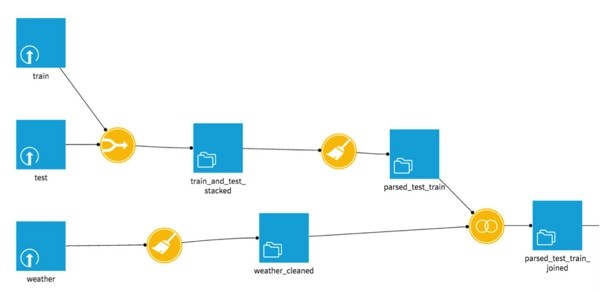
First, I stacked the test and train in order to do the same transformations and feature engineering to both. Before training the model, I will split them back.
The test and train datasets only needed the date parsed (which Dataiku DSS does easily). A quick look at the prediction column, using the analyze feature, showed that the classes were very imbalanced: 95% of the training set captures did not detect the virus.

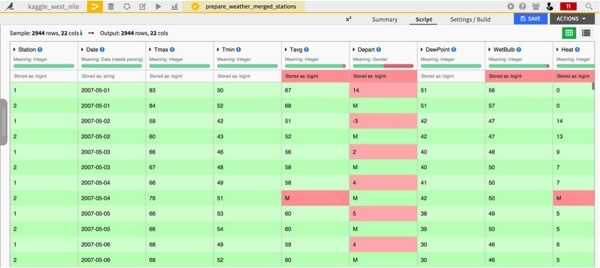
The weather data was a bit more messy. There were missing values, and some columns were interpreted incorrectly (for example Depart had so many missing values, stored as ‘M’, that Dataiku DSS thought it was a gender column).
Each date had two records, one for each station. Since I was planing to join this dataset to the training data on the date, I merged the two station records together using a custom Python processor. Then, I noticed that most of the missing values were due to the fact that station two never reports certain values, so I deleted those columns.
Finally, the remaining missing values were fixed by copying the same value of the other station.
Joining Datasets
Now that the weather datasets and test and train datasets were cleaned, they could be joined using the Dataiku DSS join action. Here is what the workflow looks like so far:

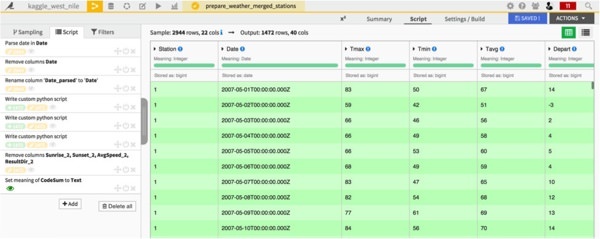
Here, I could have done some additional processing and feature engineering before building a model. For this first take, I just removed some redundant or useless columns (namely the address of the weather columns).
Building a Model
I split the data back into train and test (based on whether the West Nile Virus column is present or not), and built a model using the analyze function. The default model choice selection optimized the AUC which is this competition’s metric. It was also possible to specify how to handle cross validation, how to do feature scaling, how to deal with the missing data, and which algorithms to use. In addition, Dataiku DSS automatically took care of categorical features by creating indicator variables for each possible value.
The only thing I changed from the defaults was the CodeSum column, which was a space delimited list of weather codes (e.g. TS for thunderstorm, or RA BR for rain and mist). Rather than treating is as categorical, it made more sense to use counts vectorization (in this case the counts will be 0 or 1 for each code).
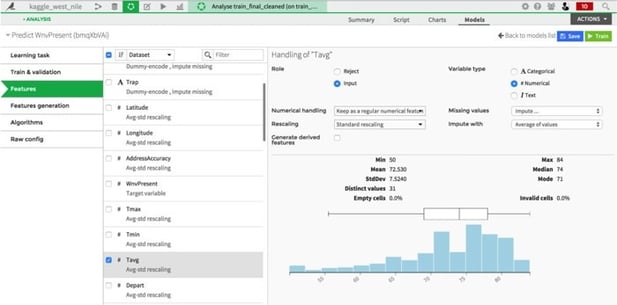
Once the model was trained, it was very straightforward to apply it to the test set, and export the predictions as a .CSV in order to submit to the Kaggle West Nile Virus competition.

The final workflow looked like this:

Results of the Kaggle West Nile Virus Competition
On May 8, there were 411 teams in the leaderboard. This submission placed me 60th. Not so bad for a first try!

To rank higher, I could do more advanced feature engineering. For example, I could take into account the weather station locations compared to where the traps are, use the number of mosquitos captured, and incorporate the spray dataset.


