


I've been reading comics since I was a little kid. Neil Gaiman, Alan Moore, Warren Ellis, and Art Spiegelman are among my favorite authors now, but when I was younger, I was a big fan of Marvel superheroes.
When I discovered the Marvel Social Graph dataset, I immediately wanted to discover how the different characters influenced each other with data visualization.
By using cluster analysis, I am going to try to figure out how my childhood heroes actually interacted with each other in the Marvel Universe.
The Marvel dataset is composed of a list of co-occurrences of super heros. For example, every time Spider Man appears in a comic book with Captain America, we will have a line with both their names. To illustrate this, here is a visual of the data in Dataiku DSS.
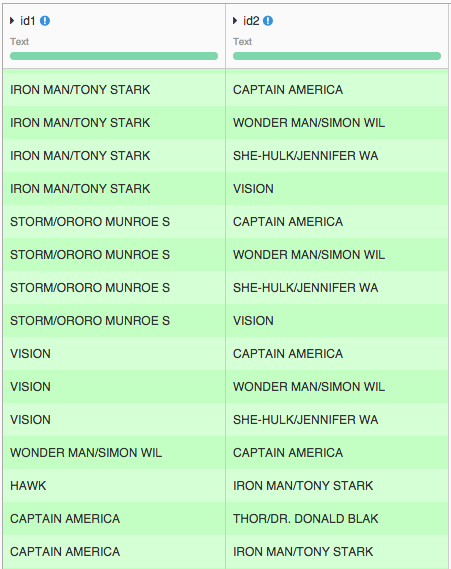
Because of these connections, it's possible to create a graph, with each node being a character and each link or line showing the presence of a co-occurrence in the dataset.
A First View of the Graph
I did all the network analysis with Python (mostly using networkx package) and used sigmajs to build a small web application to be able to visualize the network.
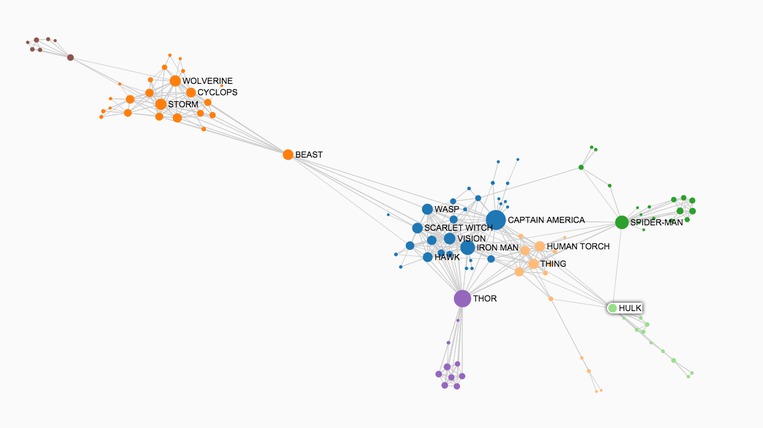
Here is the first visualization of our Marvel Social Network. The node size corresponds to the degree (number of edges adjacent to the node) in the graph and the node color to graph clusters detected with the Louvain method. I used the sigmajs force layout to arrange it.
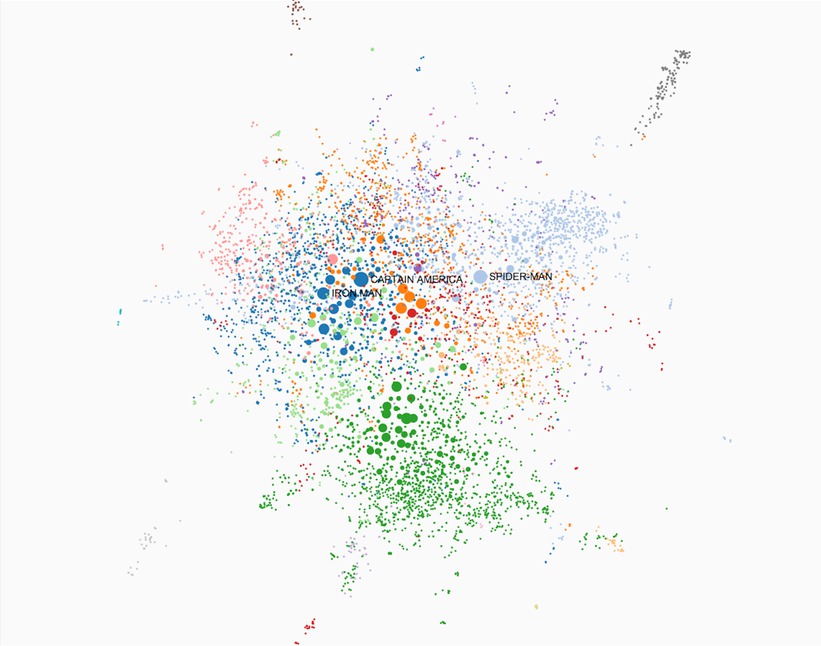
Now, most people will tell you it's rarely interesting to plot the whole graph because it will be difficult to interpret. But in this case, we can validate a few hypothesis:
-
The characters that scored the highest degrees are Captain America, Spider Man, and Iron Man. So these heroes are found to be of high importance in the social graph, which is logical since they have been part of the Marvel Universe since the start.
-
Some clusters appear:
- The pink one on the top left corresponds to Thor's universe, the green one on the bottom to the X-Men, the pale blue on the top right to Spider Man.
- The Avengers are mostly in the center of the graph, the four big orange nodes corresponding to the Fantastic Four.
- Smaller clusters can be detected in the graph periphery, but most of these characters are minor (some of them don't even have a Wikipedia page).
Pruning the Graph
We would like to understand the internal structure of the Marvel graph, but how can we prune the graph from all the unknown characters (such as Fah Lo Suee) who are polluting our graph?
One way to do that would be to use edge weights. Previously, an edge was defined by the existence of one co-occurrence. However, Captain America and Spider Man appear together in so many comics that we have to take this into account in our graph, and the solution is to use edge weights.
An edge weight is some extra information about the node that we add to our graph to change its shape. In our case, this extra information will be the number of co-occurrences between characters. For example, the edge weight of the link between Spider Man and Captain America is the same as the number of comics they both appear in together.
If we prune the graph by keeping only edges (and corresponding nodes) which have a weight that's higher than a specific threshold (K for example), we will drastically simplify the graph: all nodes with less than K appearances in the dataset and all edges with weight less than K will disappear.
So the more we increase K, the simpler the graph will be and we will get closer to the Marvel Graph skeleton.
For example, here is the graph generated when the value of K is 10.
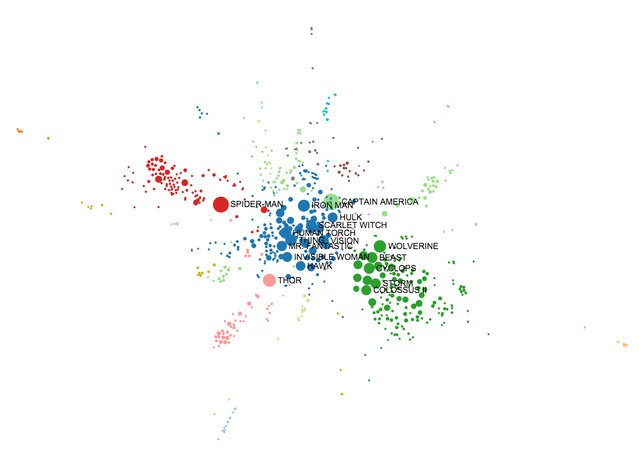
It is starting to get easier to describe Marvel Universe. Three heroes have their own very rich universe (cluster): SpiderMan, Captain America, and Thor. On the bottom left, the X-Men are still clustered together.
Other less known super hero teams start to appear like the Eternals (light blue) or Alpha Flight ("Canada's answer to the Avengers," according to Wikipedia).
Meanwhile, Iron Man, Hulk, the Fantastic Four, Hawkeye, Ant Man, and Vision all belong to the central cluster. This is because the ratio of the number of their appearance together (as the Avengers) by their appearance alone is very high.
We can do a similar analysis for K = 30.
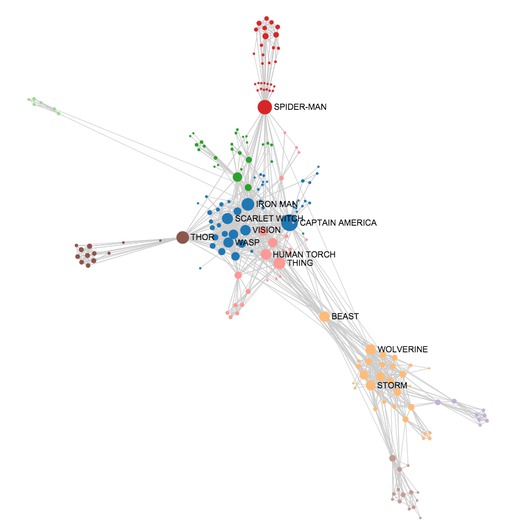
This is the backbone of the Marvel Universe. There is a cluster for Spider Man, Hulk (dark green), Namor (pale green), Thor, Fantastic Four (pink), though Captain America and Iron Man are still clustered together in the Avenger team.
Note that the X-Men are now separated in three clusters : X-Men, Generation X, and New Mutants (the latter two are spin-offs of the X-Men franchise).
Identyfing Influencers
There is a broad literature about detecting who are the influencers on social networks (for example, Twitter and Facebook).
Numerous graph criterion were derived to describe them : degree centrality , PageRank, closeness centrality or betweeness centrality. I find betweenness centrality very interesting because its value represents how important the node is for conveying information in the network to other individuals who are not connected to each other.
Obviously, Marvel stars like Spider Man, Thor, and Hulk are good candidates and have indeed very high values of all imaginable centrality measures. But if we draw the graph for a value of K = 50 the real Marvel Universe cornerstone clearly appears (the one with highest betweenness values).
It is Beast! What is surprising is that he is not the X-Men's biggest star (like Wolverine, Storm, or Professor X) but he is the main link between X-Men and the Avengers. So if I was to choose a negotiator between these two groups in a modern company, to target a person to dismantle a terrorist network or to choose my brand ambassador in Marvel Universe, Beast would be the perfect candidate.
Conclusions
I had a lot of fun mining the Marvel graph for clusters and influencers.
Obviously this analysis is a pretty basic one, so here are some other things I would consider interesting:
- Having time information would have been awesome. I would have loved to see the network evolving with the Marvel needs for new characters, spin-offs, and crossovers.
- Labeling the characters with the side they choose-during Civil War: Could we predict their affiliation the way we can in the well known Zachary's Karate Club graph?
- I am personally more of a DC fan, so if someone is able to direct me to the corresponding dataset, I would be more than happy to analyze it.
I hope you had as much fun with the Marvel Universe social graph as I did! If you're a pop culture fan, you may also like our post on Game of Thrones analytics.