


When I read a blog post about visualizing San Francisco with Open Data, I was very excited to take a stab at predicting crime and street safety as well.
I used Dataiku DSS to predict if a street in San Fransisco is safe or not, using only features extracted from OpenStreetMap (OSM). We're a few versions ahead in Dataiku DSS so my screenshots may be a bit outdated.
San Francisco Police Department Open Data

The SFPD dataset is really cool. It gives you all the incidents reported in San Francisco from 2003 until now and their precise localization. It's fast and easy to load, clean and enrich with a visual data preparation script in Dataiku DSS.
OpenStreetMap Data
Let's talk a little bit about OpenStreetMap. It's an open source project to create a "free editable map of the world" and an incredible source of data to anyone who wants to build applications based on geographical data. Indeed, people usually tag very interesting information like the category of a street (residential, highway...), localization of parkings, localization of a public transports...
With Dataiku DSS you can easily get that data for any city or country in the world. Here let's focus on San Francisco and three tables we're going to use:
- ways
- nodes
- way_nodes
Ways is a list of all ways with their geographical shape ('linestring'), the nodes composing it, and many precious information in the 'tags' field.

Nodes is a list of all nodes with their positions ('geom') and again many precious information in the 'tags' field.
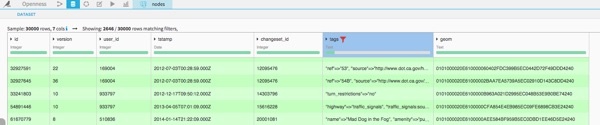
Way_nodes is the table that gives you the position of a node into the sequence composing a way.
Postgis
If we want to efficiently manipulate all that geographical data, Postgis is the perfect tool. This an extension of Postgresql whith many powerful functions to perform geographical joins, compute distances... If you're not familiar check out this guide on how to work with coordinates in Postgis.
Once you have you have set your connection to your Postgres Database and installed Postgis you're ready to start playing with OSM data.
Creating Segments and Features
First, I decided to do the analysis on street segments (between two intersections) and not on the whole streets, because if you have ever been in the US you know that a street can be very...very long. So I used Postgis within an SQL script to create the list of segments with their geography.
Secondly, I extracted all the POI (points of interests) from the tables ways and nodes (still with SQL script) and I classified them into several categories: shop, entertainment, transport, amenity... What do I call a POI? This a way or a node with an interesting tag which enables us to classify it in one of the previous categories.

Now, I have everything I need to create characteristic features for our segments. Here is a (non-exhaustive) list of all the indicators I thought about but if some others come to your mind please feel free to reach out to me and we can improve the model together:
- Distance to closest public transport
- Distance to closest shop
- Distance to closes parking
- Density of public transport within 100m, 250m ..
- Density of shop within 100m, 250m...
- Density of parking within 100m, 250m...

I also thought I could see all the segments as a network and get information from the structure of the city. Two segments of two streets (nodes of the network) are connected if they cross in the reality. In order to do that I used networkx Pyhton package to generate the graph and compute several network scores like for example the degree centrality of a segment.
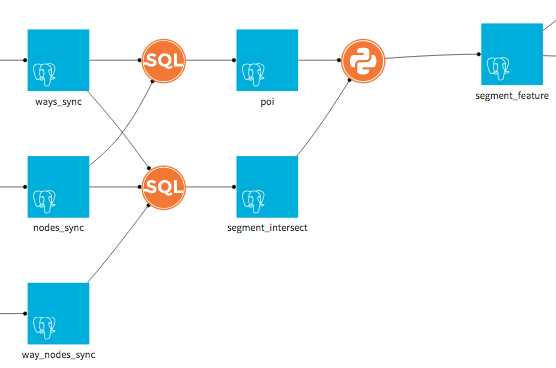
Here is the flow corresponding to this feature generation:
Geographical Join
I now have one dataset with segments (geography and features) and one dataset of geolocalized crimes. The 'natural' thing to do is a geographical join between these two datasets. I want to match segments and crimes, again this is a job for Postgres and the function STdistance is our friend.
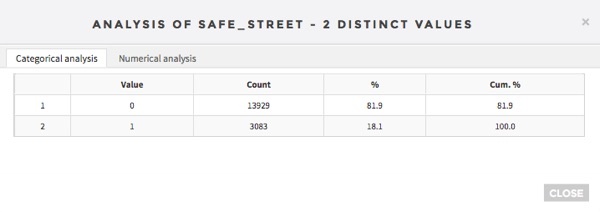
My final dataset is 17012 lines (one for each segments), 106 features coming from OSM and one target column which is a Boolean with set to 1 if the stree is safe (has never had a crime) and 0 if not (at least one crime since 2003). This gives us 18% of safe streets.
Creating a Predictive Model
Let's get started with the most exciting part. Are the features we computed related to crimes? Can we actually predict if a street is safe or not based on them?
For this task, the analysis bench ofDataiku DSS is great to build a machine learning model in only three clicks! It deals with missing values, parameters etc and I have almost nothing to do.
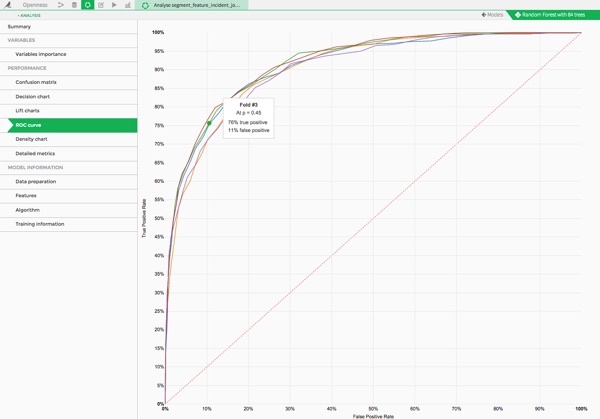
So here are the results of our classification problem (Random Forest and Logistic Regression) without any optimization or grid-search.
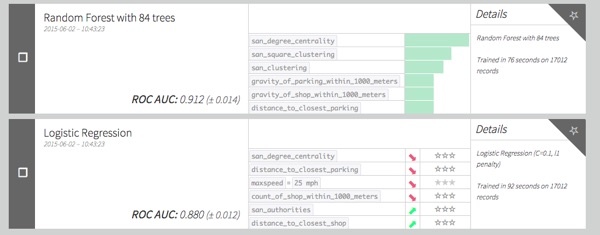
Quite good right ? We have have a 0.9 AUC with a 5 fold cross validation.
And there are plenty of fun charts to analyze the performance of your models. For example I like the density chart. It plots the density of predicted probabilities for both classes:
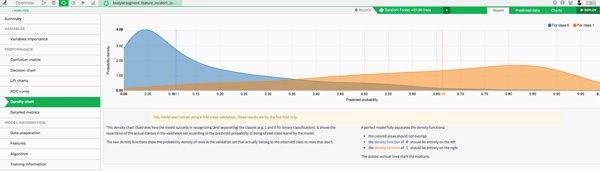
You can see how well our model separates the distributions of safe and non-safe streets! The higher the predicted probability is, the more segments of class 1 (safe streets) we have.
Interpreting and Vizualizing the Results of the Model
Now that we have a good score, the interesting thing to do is to look at our model and the feature importance, so that we can get information on what is underlying crime rates, and what are the characteristics of safe and non-safe streets.
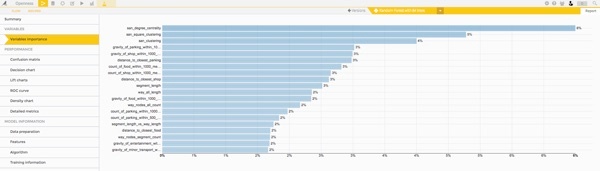
We see that the top ranked features are the ones related to graph characterics. For example, the centrality degree represents how much a segment is connected to other segments. As the name indicates it's a centrality measure.
The OSM features that comes next is a density measure like density of shops. It's a way to measure the level of activity in a segment.
2.0 I built a map in a webapp to vizualize the top features with a heatmap (from blue to red). This ias another way to see if we can easily detect a correlation with safe streets (green points).
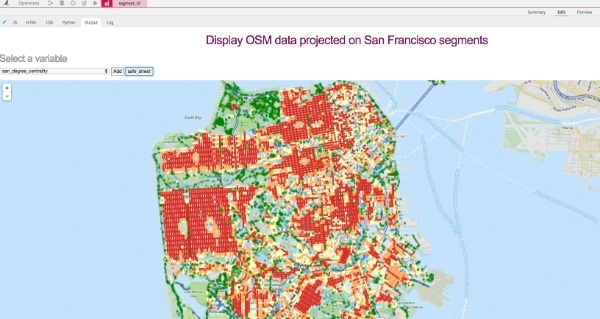
Clearly the centrality of a street segment is anti-correlated with safe streets!
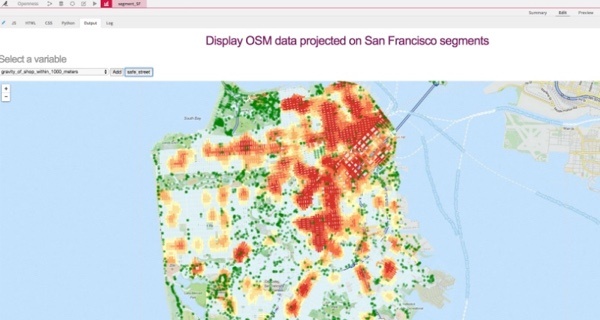
Again, the density of shop is anti-correlated with safe streets!
So basically safe streets are not in the city center and have few shops close to them. This could seem counter intuitive, but think about it this way: crimes happen where there are lots people and things to rob! So basically the most touristic regions of San-Francisco are also the most "dangerous".
Download a free version of Dataiku DSS to try this project yourself, or use it on your own data.