When I first moved to France I had so many questions about food. What is an "aperitif" and why am I expected to bring one to dinner? You did what to that goose? And wait, cheese can be a dessert?
I still have a ton of questions. But thankfully, the French government tracks food-related data through their census bureau. Let's try to get to the bottom to some of my questions with Dataiku DSS and data from France's census.
Data Prep
I downloaded the most detailed set of census data that I could find from here. It contains all sorts of weird information, like the number of open-air bowling alleys in each district. More importantly for us, this data also contains information on all of France's stores: bakeries, cheese shops, butchers, etc.
I also downloaded the contours of the districts. These let us know the geography of each district and let us visualize the data on a map.
I uploaded all the datasets into Dataiku DSS, synced them to my PostgreSQL database and did a big join.
Luckily, doing this in Dataiku DSS was as simple as a few clicks:
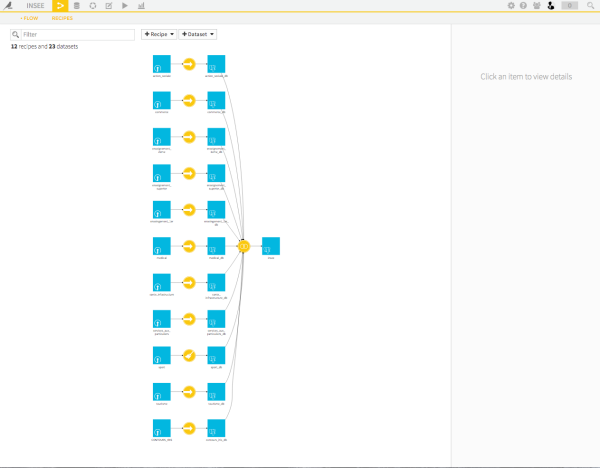
If you're looking for more information on this step, check out our how-to sections on databases and joins.
Making Interactive Maps with Dataiku DSS
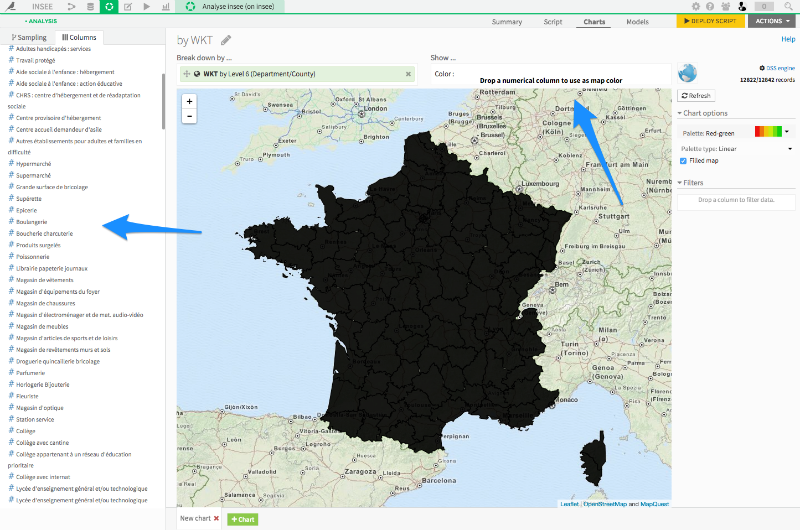
Dataiku DSS lets you make interactive maps through a click-and-drag interface. I'm now going to open my dataset with all of the census data, and do some exploration just by clicking and dragging columns into the interface:
The South (and Paris) love their "Epiceries"
Ah, the French épicerie: part green grocer, part corner shop, essential to the French mode de vie. Which parts of France have the most épiceries per capital? Let's plot the data from the French government to find out.
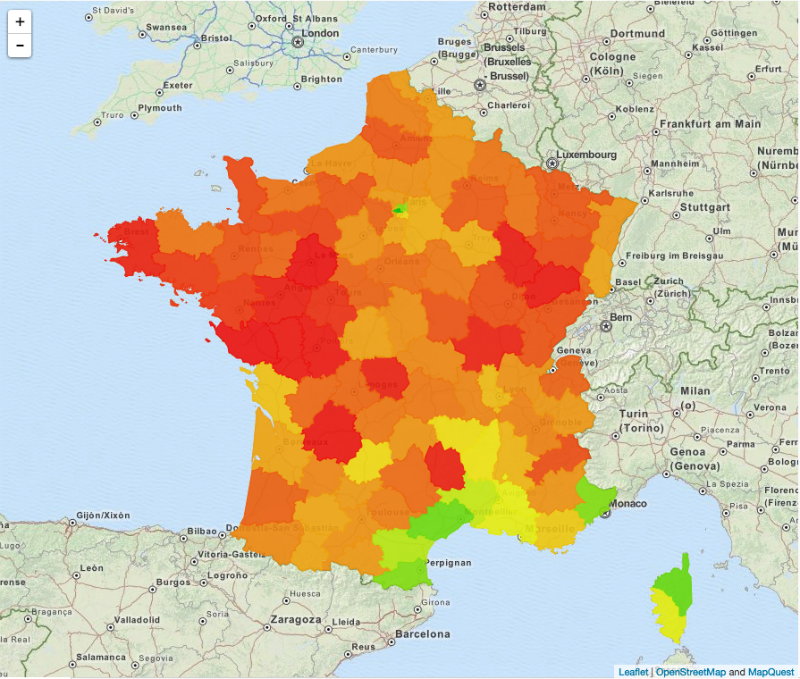
On the map, green shows regions with more "epiceries", while red shows regions with fewer. It definitely looks like the south and Paris appreciate their fresh vegtables.
The West Enjoy Their Fish
Oysters, shrimp and sole meunière ... France has its share of great seafood.
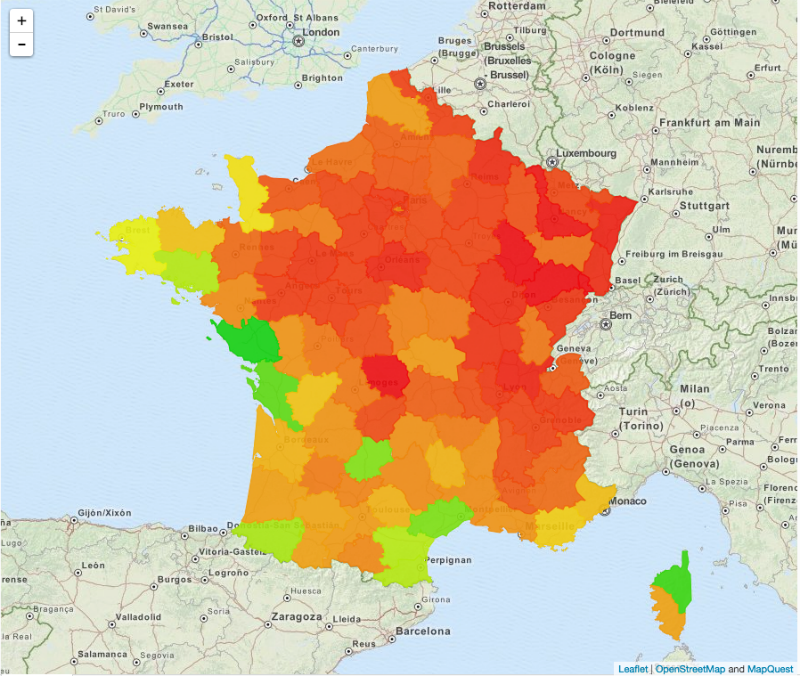
Fortunately, the French government tracks the number of fish shops or "poissonneries". It seems like the west and the south enjoys seafood more than the rest of the country.
Auvergne is Cow-Crazy
Cote du boeuf, filet mignon, and steak tartare. When I think French cuisine, I think beef. Which region has the most butchers? It's Auvergne!
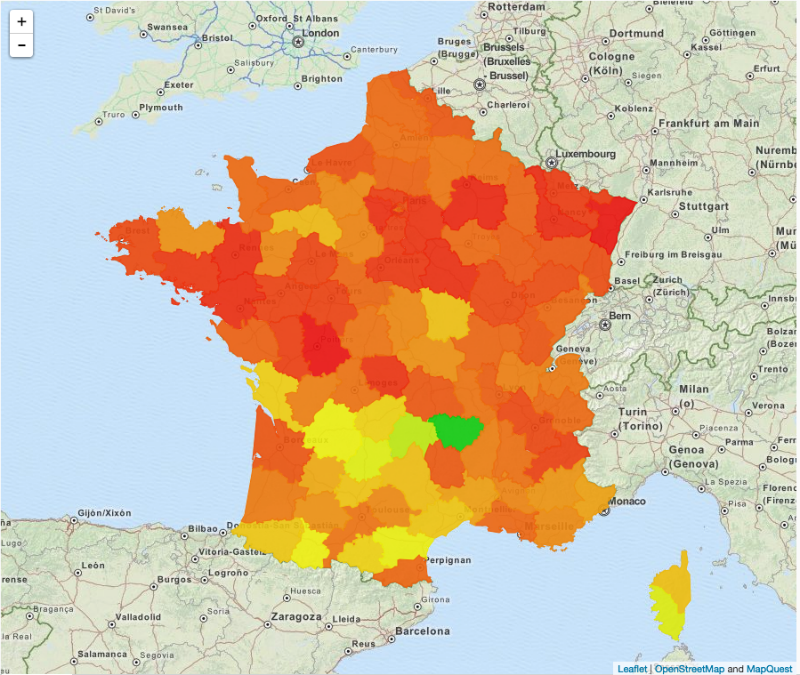
I'm told that this is somewhat of a stereotype. In fact, the Auverge tourism council proudly displays a herd of cattle in their promotional video.
I appreciate a region that appreciates its cows.
Paris and Perfume
It's not really food-related, but we can also look at number of perfume stores for each district. This map shows a sea of red with a tiny green speck -- Paris.
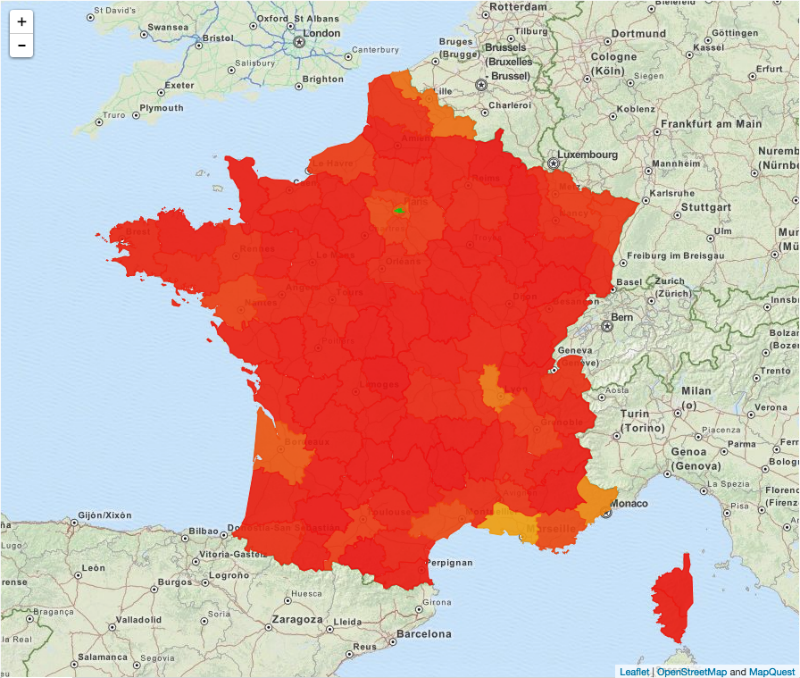
Paris does love its luxury goods, so I'm not too surprised there's such a drastic distinction between Paris and the rest of the country.
Recap
Dataiku DSS makes it easy to create interactive maps. Pretty quickly, we uploaded data from the French government, did a huge join and then started exploring the data with interactive maps.


