At Dataiku, every new member of the team — from marketers to superstar data scientists — learns the Dataiku platform with the Titanic Kaggle Competition. It's such a milestone in the company that our first meeting room was named after it! This blog post will serve as a tutorial on how to submit your first Kaggle competition in five minutes.

Why Kaggle?
Kaggle is a great site where companies or researchers post datasets and make them available for data scientists, statisticians, and pretty much anyone who wants to play around with them to create insights. Some focus on serious topics like fraud detection, while others are more light-hearted technical challenges like this one on generating dog images.
Many Dataiku data scientists participate in Kaggle data competitions, but the Titanic challenge is a classic and great for beginners. Why? Because everyone can understand it: the goal of the challenge is to predict who on the Titanic will survive.
Collect Kaggle Data
Before really getting started, create an account on Kaggle. Don’t worry, these guys aren't big on spamming (at all). Now, to begin the challenge, go to this link. This is where you will go to get the data sources. We only need two datasets for the project: the train dataset and the test dataset. Go ahead and click on the links to download them.
Now open up Dataiku (if you have it already) or download the Dataiku Free Edition. From there, create a new project (changing the project image is optional).

Getting Started
Click to import the first dataset. Upload both .csv files separately to create both test and train datasets.
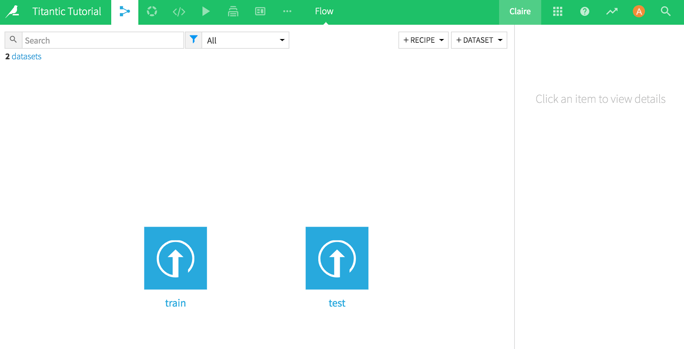
Check out the flow. This is what it should look like:
Interlude: Test vs. Train
When working on machine learning projects, there will always be a test and a train dataset. The train dataset is a set of incidents that have already been scored. In other words, the predicted feature is already known for each data point. This is the dataset that is the basis of algorithmic training (hence, the name).
The test dataset is the dataset that the algorithm is deployed on to score the new instances. In this case, this is the dataset submitted to Kaggle. Here, it's called 'test' because it's the dataset used by Kaggle to test the results of each submission and make sure the model isn’t overfitted. In general, it'll just be the data that comes in that needs to be scored.
Tip: Both datasets have to have the same features, of course. So at Dataiku, we'll often stack them at the beginning of our data wrangling process, and then split them just before training our algorithm.Build the ML Model
Now, click on the train dataset to explore the data.
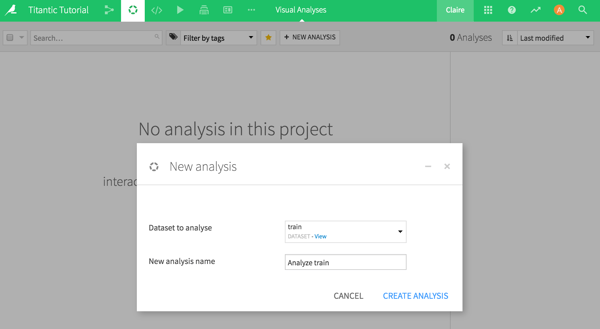
Our goal today is to submit on Kaggle as fast as possible, so I won't go into analyzing the different features and cleaning or enriching the data. At a glance, notice that there is a unique passenger ID and 11 features, including the feature we want to predict: "survived." Let's go ahead and click on Analyze to create a new analysis:
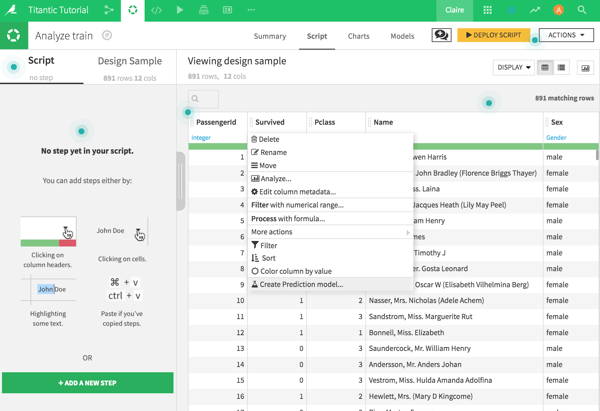
The next step is to go straight to the header of the "survived" feature, click, and select Create Prediction Model— the model is ready to train. Now that was easy!
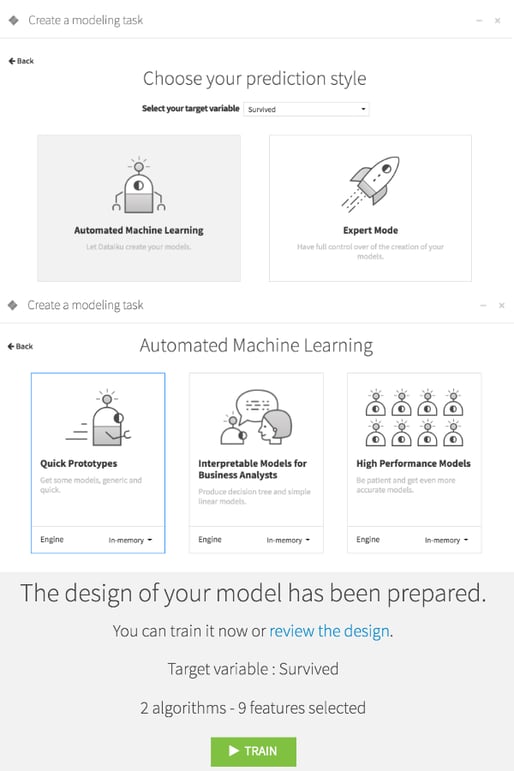
Click on Train. There are a few options for predicting, but we’ll start with the simplest ones. Select Automated Machine Learning and then Quick Prototypes. Voilà — the model is done!
By default, Dataiku trains on the random forest and logistic regression algorithms and ranks them by performance as measured by the ROC AUC. The random forest algorithm outperforms the other here, so click on that one.
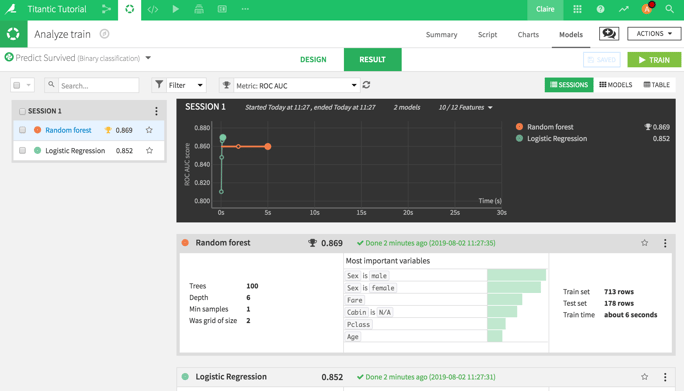
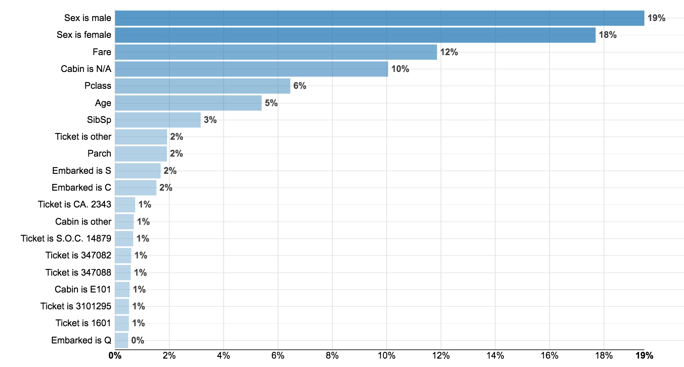
It is interesting to have a quick look at the Variables Importance. Pretty unsurprisingly, gender is the most decisive feature, as well as how much a passenger paid and the class. As far as this model is concerned, the Titanic wasn't so much about "women and children first" as much as "rich women before rich men."
Deploy the Model
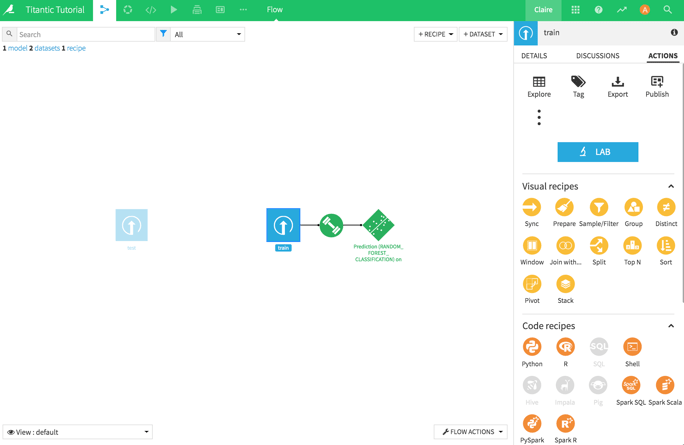
Now that the model is built, it’s time to go ahead and deploy it. Go to the right corner and click Deploy. Keep the default name and deploy it on the train dataset. Now, there is a new step in the flow! Check out that model!
Apply the Model
The next step is to apply that model to the test dataset. In the flow, click on the model and then click on Apply Model on Data to Predict on the right. Select the test dataset and hit Create Recipe.
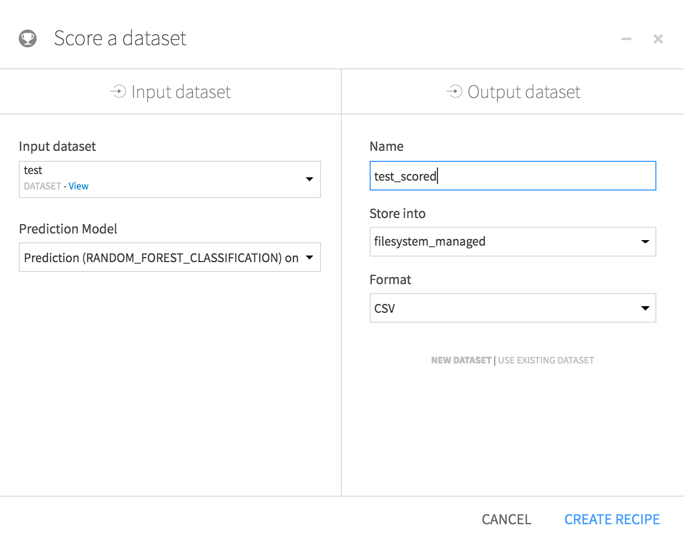
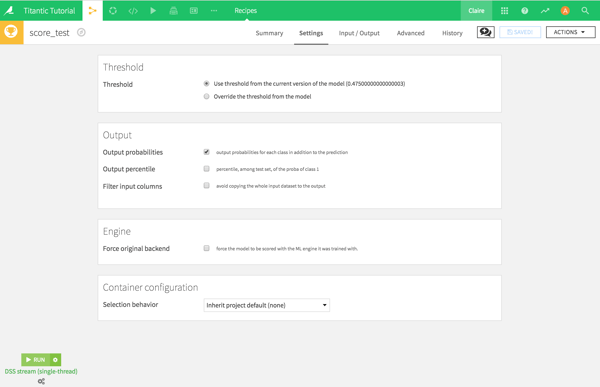
Then, run the model with the default settings.
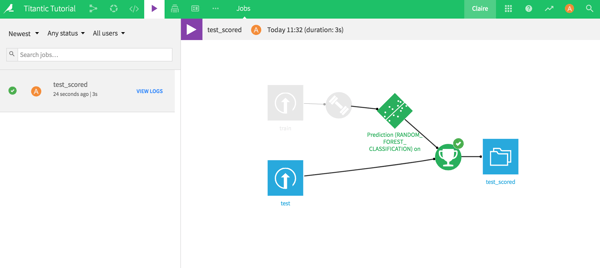
Then, explore the output dataset test_scored. There are three new columns: a prediction column at the far right indicating whether the model predicts if that passenger survives or not and two columns with the probability for each output.
Format the Output Dataset
When learning how to submit your Kaggle, the final step comes down to preparation. Kaggle requires a certain format for a submission: a .csv file with two columns, the passenger ID, and the predicted output with specific column names.
Go ahead and create an analysis of the scored dataset. Rename the prediction column "Survived." Then, add a step in the analysis to retain only the passenger ID and the prediction columns.
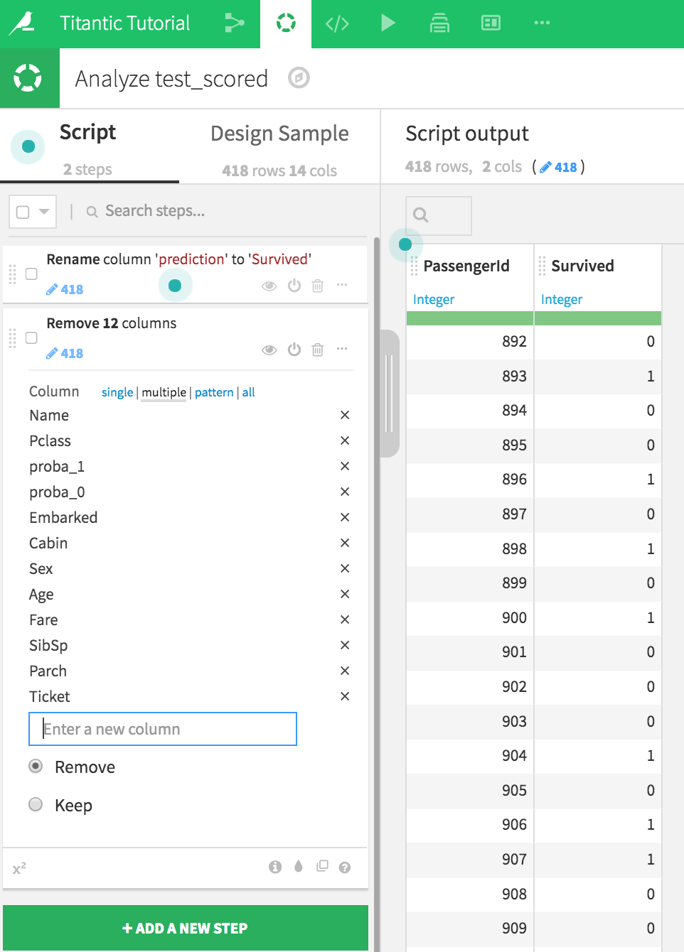
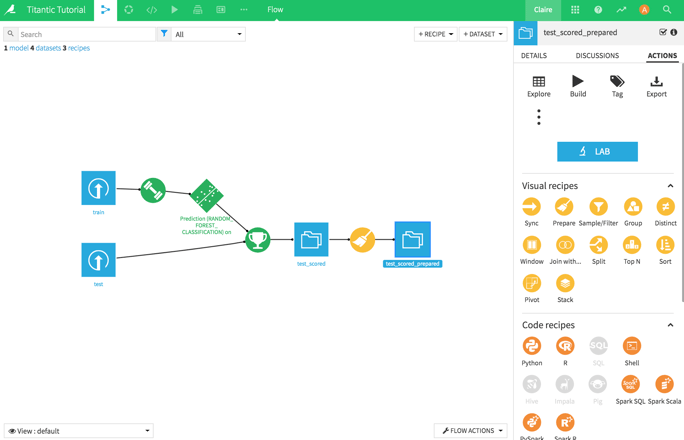
Now that it’s in the right format, deploy the script, rename the dataset (optional), and select to build the new dataset now. Back in the flow, click on the final dataset. On the right, click on Export and download it (in .csv).
Time to Submit!
When it comes time to submit your Kaggle, go to this page and hit Submit Predictions to make the submission! Drag and drop that .csv file and submit.
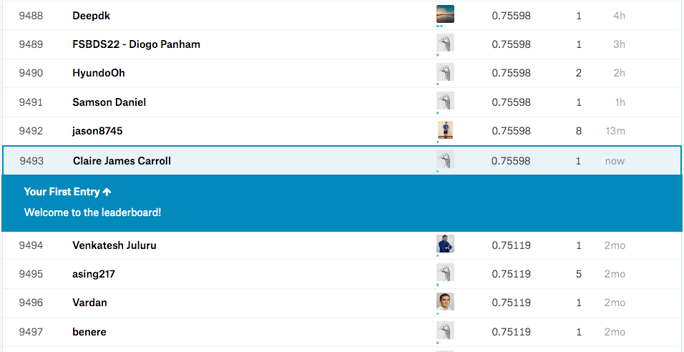
I got a score of 0.75598, which isn't a bad ROC AUC. I ranked in place 9,493 out of 11,718. Okay, that's not great, but it leaves a lot of room to improve! For five minutes of work, that’s not too bad.


