Pierre Bourdieu first made a very strong impression on me when I was just a college student. Not only did he have a funny-sounding name, at least to a French ear, but he was one of the most prominent sociologists of the 20th century.

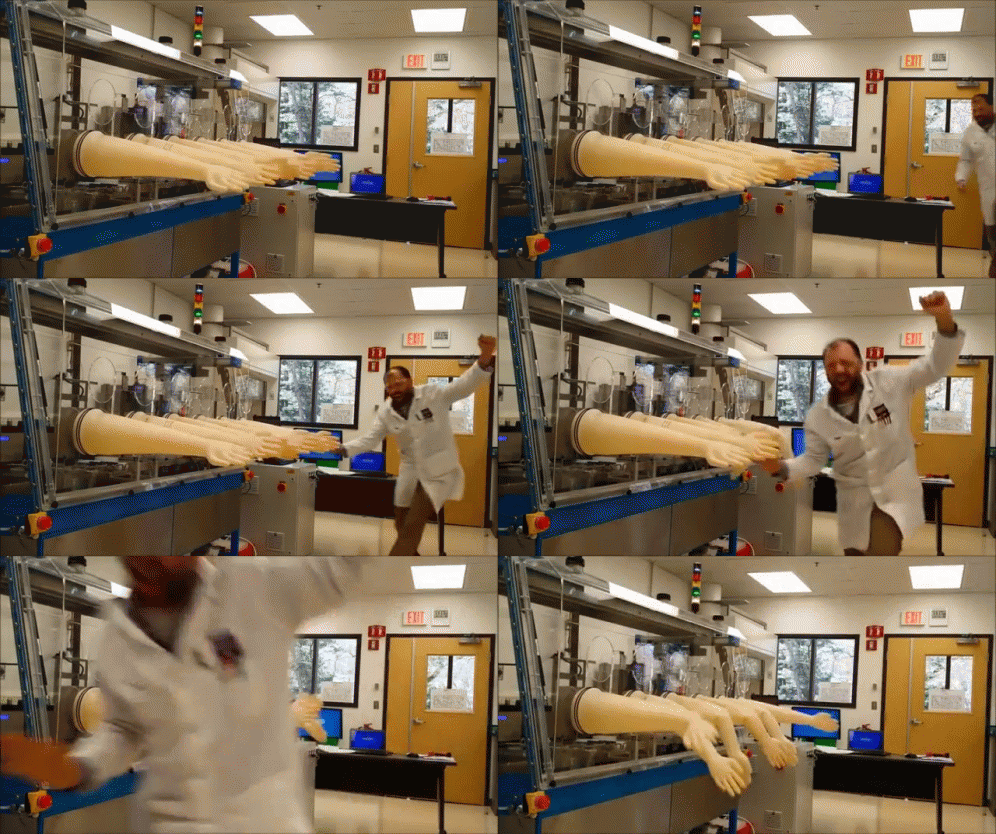
Check out that amazing body language!
In his book, Les Héritiers, Les étudiants et la culture, Bourdieu shows that social reproduction contains an inherent cultural component that is often not consciously acknowledged. This cultural heritage, along with the knowledge and the savoir-faire acquired in the family environment, ensures an even stronger inheritance than money alone. Put plainly, perhaps to succeed in life, get into (and fit into!) Harvard for instance, you not only need intellectual capacities or money, but you also need to have mastered a cultural code.
As an aspiring mathematician, I naturally wondered whether such mechanisms of social reproduction also happen in the research community, even though it's renowned to be a meritocracy. Could it be that a researcher's success does not only depend on their findings but also on how well they fit in with the community?
A thorough sociological study of cultural reproductions in academia goes well beyond the scope of this blog post of course, but let's take a look at how a data-driven analysis can shed a little light on some of those mechanisms.
What Does It Take to be Published in Nature or Science?
Many researchers often wonder how hard it will be for them to publish their findings in the most prestigious journals, say Nature or Science. Pretty hard, for sure. But how hard is it exactly? The obvious answer of course, is that you need to submit original and innovative results. But how can you know that your findings are truly original and innovative?
I am not quite ready to build a model that assesses your chances of having your paper accepted by a major publication yet, but I'd like to see how true the saying is: "To publish in Nature, you need to have already published in Nature!"
Or, to put it more conservatively, how hard is it to publish in a journal if neither you nor your co-authors have already published in this journal? Spoiler alert: it's hard.
An In-Depth Analysis of Nature's Dataset
To answer this question, we collected historical bibliographical information from three major journals at Dataiku: Nature, Science, and Acad. I focused mainly on the Nature dataset which consists of 264,886 research articles spread out from 1869 to 2008. Let's take a look at the dataset!
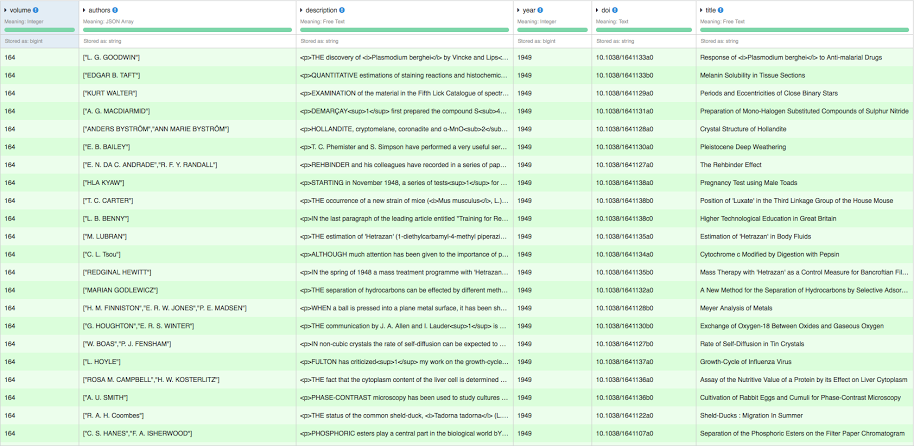
To better understand this dataset, I did a bit of statistical exploration.
Here Are Some Interesting Facts:
- In 1978, there were about 1,600 published research articles. Thirty years later, the number of publications dropped to about 800.
- Until now (because yes, there are still papers being published in Nature today!) 74% of authors where only published once in Nature, 14% published twice, and only 5% three times.
- Overall, since 1869, there is an average of two authors per article. However it is interesting to note there is a very strong evolution: in 1998, the average is five authors per article, and in 2008, it is 10!
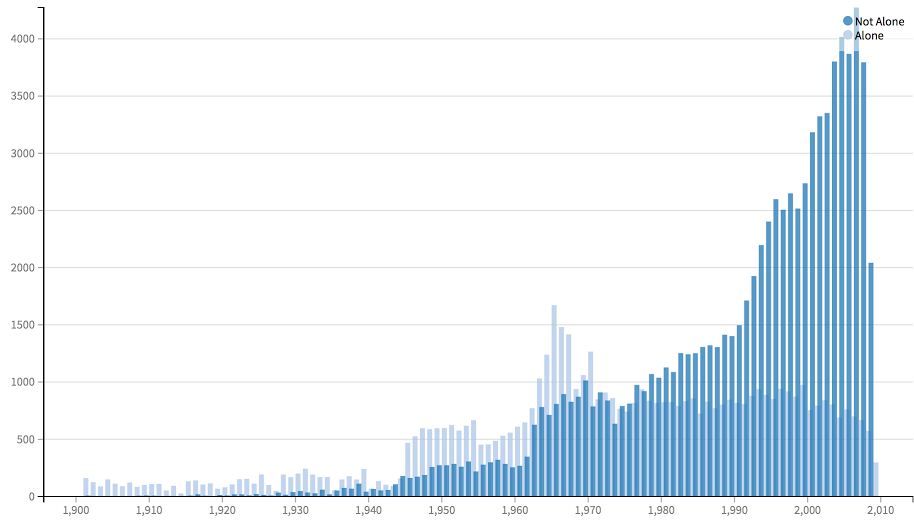 Check out the evolution of the number of writers published
A Very Natural Bias
If the scientist's ultimate quest is truth, the data scientist has an ultimate nemesis: bias. Bias can take many forms: sometimes it is inherent to the data, other times it comes from the very way data is collected. In our situation, there is a natural bias we have to account for. Not very surprisingly, there are homonyms amongst the authors of such a long-lived journal.
To resolve that lexical ambiguity, I started by filtering records along different criteria. For instance, I checked out the time span of publications of an author: it's better if it's below 70 years. Another interesting criteria is the total number of publications per author and inspect authors with suspiciously high total. Of course, there are also a couple very very prolific authors like T. D. A. Cockerell, an American zoologist with the most research publications in Nature: 142 published papers over 57 years. He's definitely an outlier!

It's About Time to Analyze Our Data
It's finally time to dive into the main part of the analysis. I first restricted the data set to the first publication of each author. This was very easy with the group by recipe in Dataiku DSS and gave me a dataset of first publication. I then iteratively joined the data set on itself to retrieve the year of first publication of the co-authors. This was also super easy with Dataiku DSS's visual recipe to perform joins in a few clicks!

This is what my flow looks like in Dataiku DSS.
And that's all I needed to do! Now all I have to do is compare the year of first publication of an author with the year of first publication of his co-authors.
The graph below shows the evolution of the number of researchers that first published in Nature with co-authors who had already published in Nature, versus researchers that first published in Nature either alone or whose co-authors where also publishing for the first time.
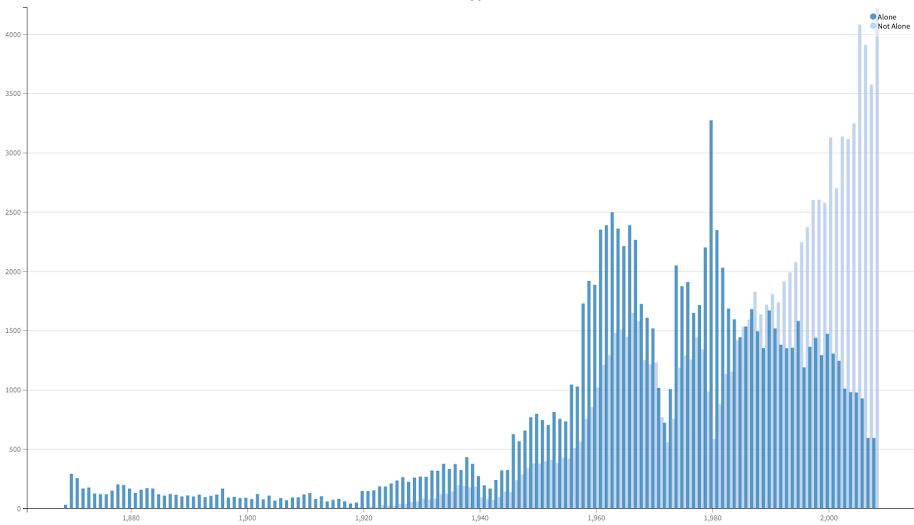
This is the graph with absolute values...
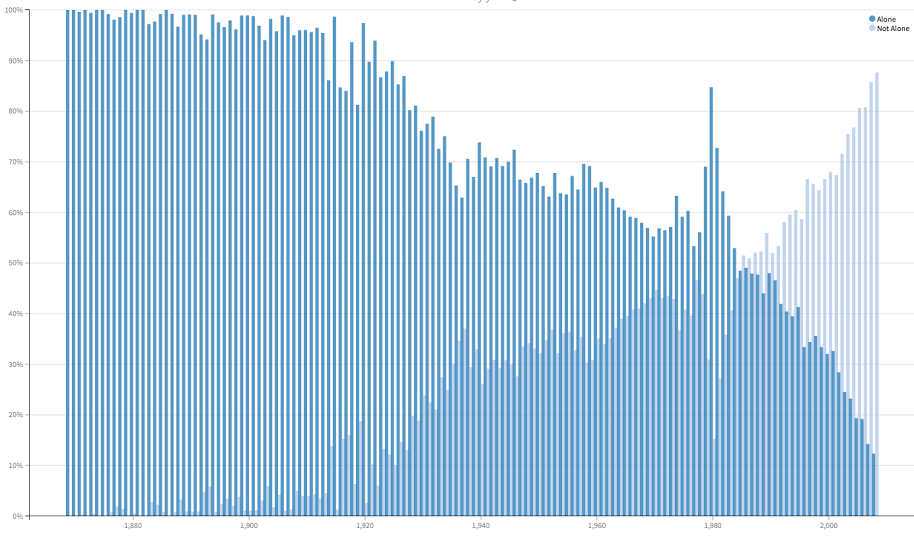
...And this graph shows the percentage.
Let's Talk About the Chart:
In light blue, you can see the researchers who first published in Nature 'alone', i.e. by themselves or with co-authors who had never published in Nature before; while the other researchers with co-authors who had already published in Nature are in dark blue.
There are a few interesting things to notice in those charts.
- Since 1985, there are more first articles published in Nature from authors with co-authors that have already published in Nature.
- In 2008, only 12% of first publications in Nature are from researchers whose co-authors (if they had any) had never published in Nature before.
I also carried out the same study on the Science dataset and below are the corresponding results:

This is the graph with absolute values...
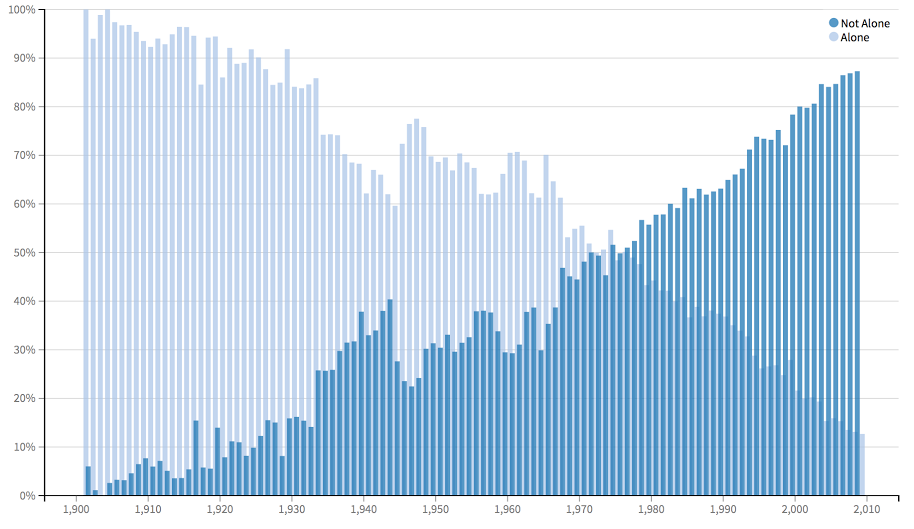
...And this graph shows the percentage.
You can make pretty much the same observations. If you want to be published in Nature, you should probably find someone who was already published in Nature and go from there.


