


This blog is a guest post from our friends at DataDrive. They are a modern analytics firm located in Minneapolis, Minnesota focused on delivering impactful data-driven outcomes through their unique Human Centered Data™ approach. They create best-in-class data products and business solutions that help teams realize the full power and potential of analytics by focusing on the last mile of analytics.
The Great Resignation
Monthly quit rates rose from a pre-pandemic five-year average of 2.2% to 2.9% in 2022, which is a 37% increase in average yearly voluntary turnover (aka quitting). If employee quit rates remain at an all-time high or maintain current trends, businesses could continue to experience a 37% increase in voluntary turnover cost! Exacerbating the issue, companies are competing for a limited talent pool.
U.S. Monthly Quit Rates
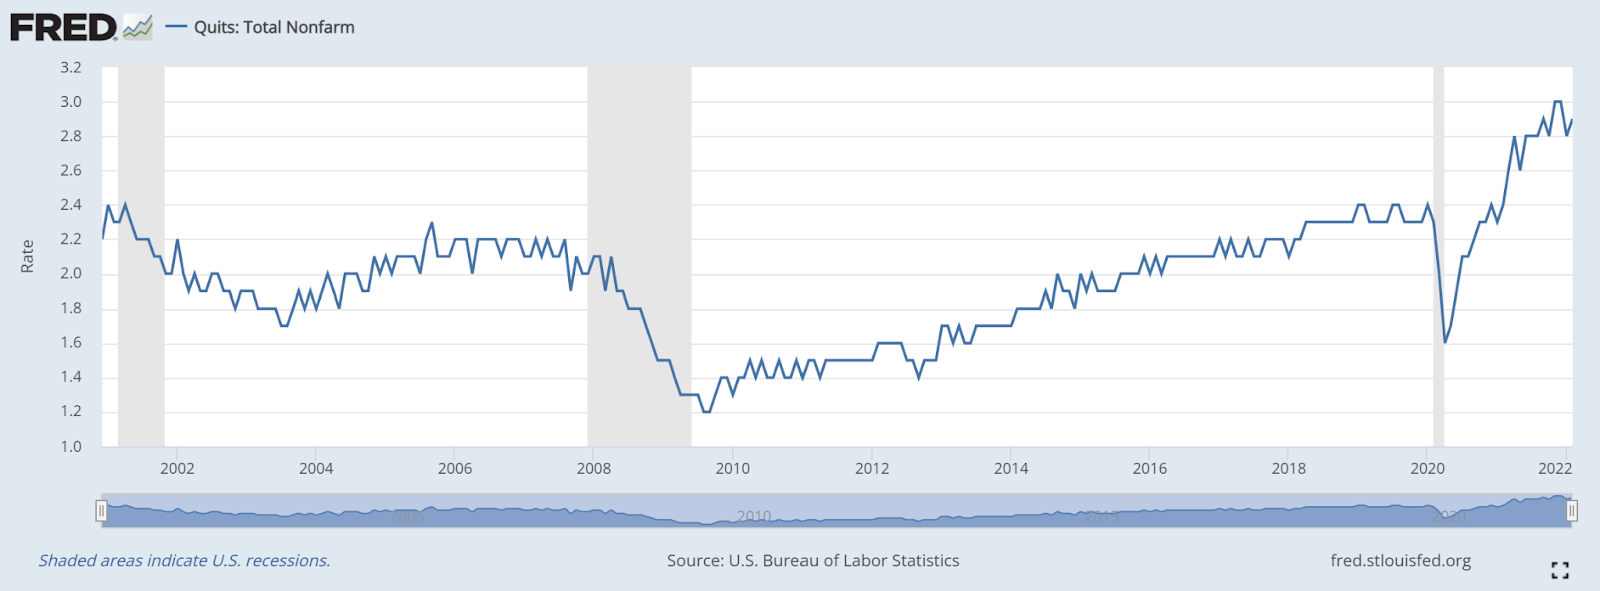
All industries seem to be grappling with the question: Why do employees voluntarily leave? The “grass is greener” syndrome is in effect. It has been enabled by an optimistic economic environment, decreased career satisfaction, and introspection catalyzed by the pandemic. Additionally, stable factors like work environment, compensation/benefits, and more continue to affect retention.
To become proactive, your organization will need to define, collect, and monitor actionable metrics about the health and well-being of employees. Doing so will enable your organization’s ability to leverage attrition modeling to rank the most likely employees to turn over. In turn, leaders can proactively and efficiently target solutions (in partnership with data scientists) to retain the most valued employees.
This article helps you identify if your organization is ready to begin attrition modeling, avoid common traps, and how to incorporate solutions into your organization's employee retention decisions with velocity and transparency using Dataiku.
Are You Ready for Attrition Modeling?
In order to begin attrition modeling, you will need a few things:
1. A few years worth of reliable data. The data is complete (no/limited gaps in time), is consistent (collected by the same means for the same outcomes), and is informative to describe why an employee resigned (see below metrics table).
2. Clearly defined actions to remediate resignation reasons. For example, your attrition model outputs that a certain gender identity is a primary factor toward risk of quitting. A possible subsequent action would be to update the company's social, diversity, equity, and inclusion programs.
3. Strategy for using a model's output. Be proactive in curbing attrition risk early. Ensure employees have updated development action plans (DAP) to define their goals and motivations. Support your team by providing the right monitoring tools to capture the risk of resignation early with exploratory dashboards. Initiate regular communication with employees to tailor benefits, work environment, and flexibility to meet their needs.
4. Understand the holistic view of objectives and goals. It may be obvious building an attrition model has the goal to reduce turnover, but how else are the actions taken affecting the health of the organization (i.e., job satisfaction, productivity, group cohesion)? You want to holistically balance the health of the team, not just the rate of turnover.
Be Cautious of...
Composition of primary reasons for resignation will change over time. During the pandemic, a common reason for leaving a job was the commute, however, with work from home and hybrid being more common, this reason is becoming less significant across many industries and positions. Awareness of these changes can help your organization avoid taking action where it doesn't matter and instead invest where it does to drive employee retention. These changes also mean you will need to continually retrain your attrition model to capture the changing importance of factors.
Ethical and legal chasms. Be careful of the metrics you choose to monitor and the actions you take from them. Using race as an indicator may be viewed negatively by employees and depending on the actions your organization takes it may infringe on civil rights laws. A good rule of thumb is to use data that employees have voluntarily given the company or know is being collected and create clear, transparent communication strategies on actions taken (proactively and retroactively).
The data you collect will affect the behaviors of your employees. This is called the Hawthorne Effect. An example could be the use of “average number of emails sent per day” as a proxy for work ethic. If employees realize this factor is being monitored, they may believe emails could affect compensation and may focus on sending more per day as opposed to quality work.
It is imperative when building an attrition model it is not a one-time exercise, but an ongoing iterative process. Always retrain your model, add and remove indicators/variables to reflect actions you can take, and review your HR processes on whether they are meeting business goals holistically.
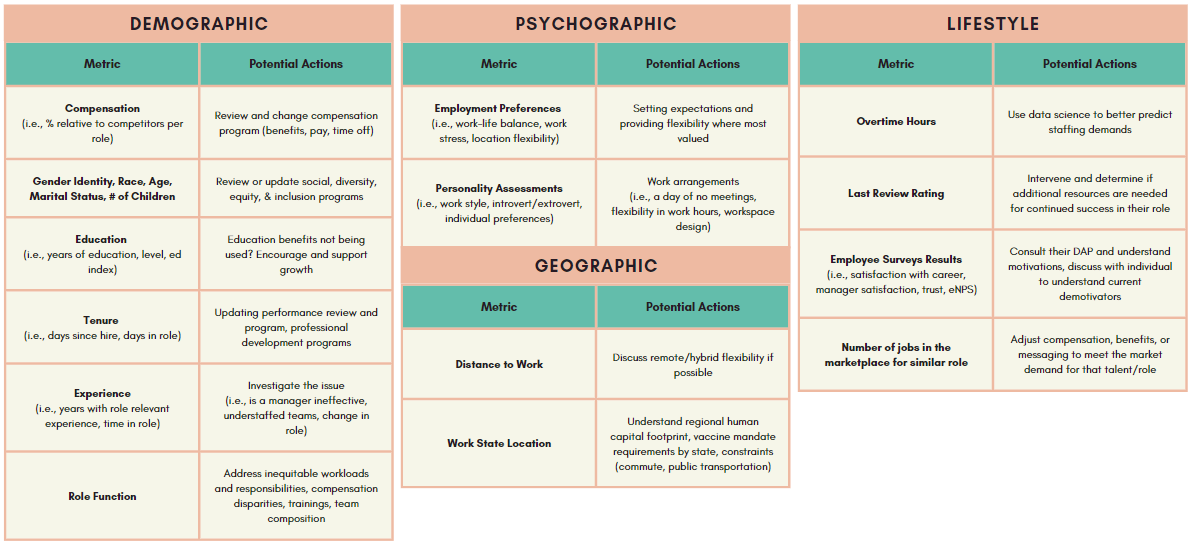
Examples of Metrics & Actions
Below is a list of common metrics to consider collecting and using in your attrition model. If there are metrics missing in the list below which are commonly referred to as reasons for resignation or logically make sense as drivers of resignation in your business, consider adding them to your attrition model.
How Is Attrition Modeling Different (and Better) in Dataiku?
Dataiku is designed to make modeling simple, fast, and actionable for developers of varying talent ranges enabling organizations to grow their advanced data practice quickly and with the resources they already have. Dataiku naturally addresses common data science pitfalls by helping organizations with the velocity of model creation and deployment and transparency in how work is created and communicated to data users and business stakeholders.
Velocity
Historically, attrition models required a mix of professionals including an HR subject matter expert (SME), data scientists, and data engineers to develop the code to run a predictive model and productionalize it. This process takes weeks or months to develop and productionalize, during which valuable time and employees can be lost.
In Dataiku, the HR SME can leverage its simple user interface and auto attrition modeling without the need for data developers. Dataiku is designed to make the most time-consuming tasks (including data exploration, data modeling, and productionization) fast for non-data and data specialists alike. What follows are key Dataiku features and capabilities that can help both data scientists and key stakeholders during an attrition modeling project.
1. Data Exploration
Users have the ability to analyze data, factoring in all data pipeline changes. This helps diagnose issues in logic, ensure the readiness of the data, and confirm the value of variables to include in an attrition model. These tools help users to quickly validate the “Are You Ready for Attrition Modeling?” requirement for having reliable data.
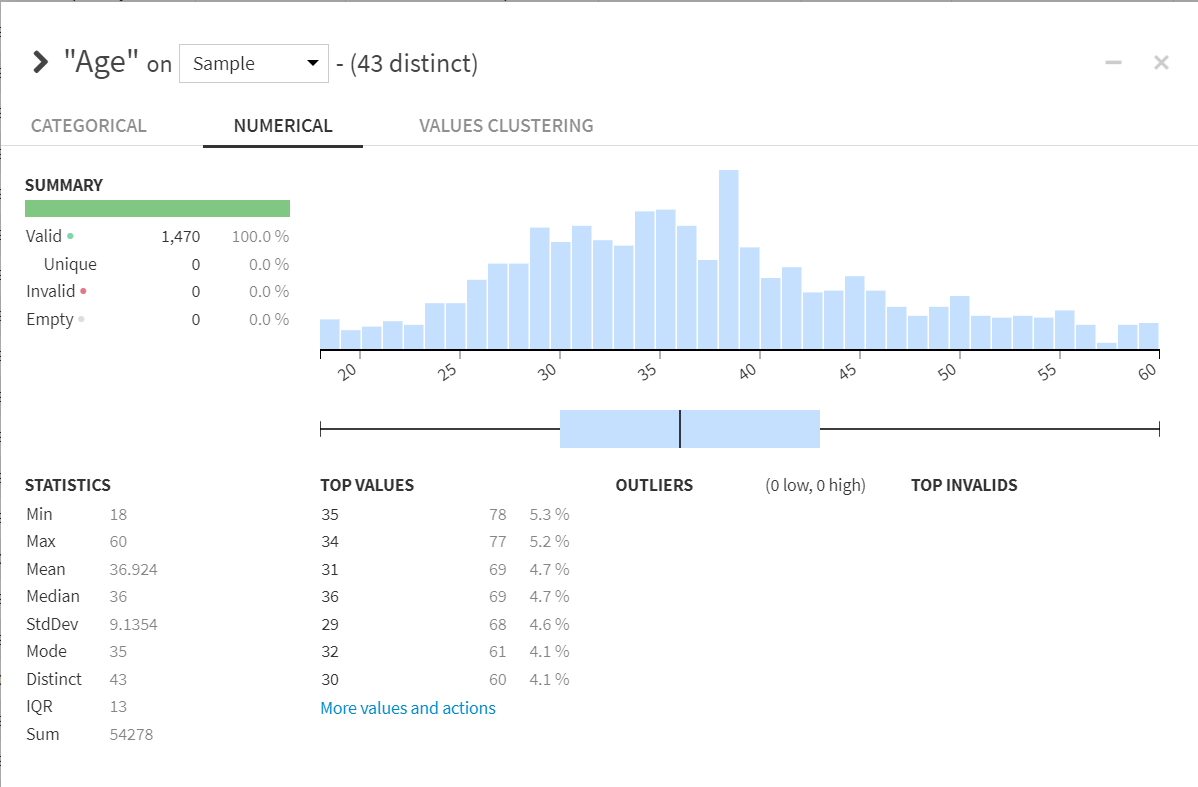
Column Summaries: Data column statistics help orient users on data cleaning needs such as completeness of data, outliers, and distribution of values helping to inform reliability of data quickly.
Detailed Column Stats:
Statistics: Users are able to run a suite of statistical tests to better understand the significant relationships that may exist between variables or objectives (i.e., turnover reduction, improved job satisfaction). This is important in the discovery and understanding of which variables should be included in an attrition model and which relationships were unexpected. Either can inform current trends or concerns with existing objectives which may need to be acted upon.
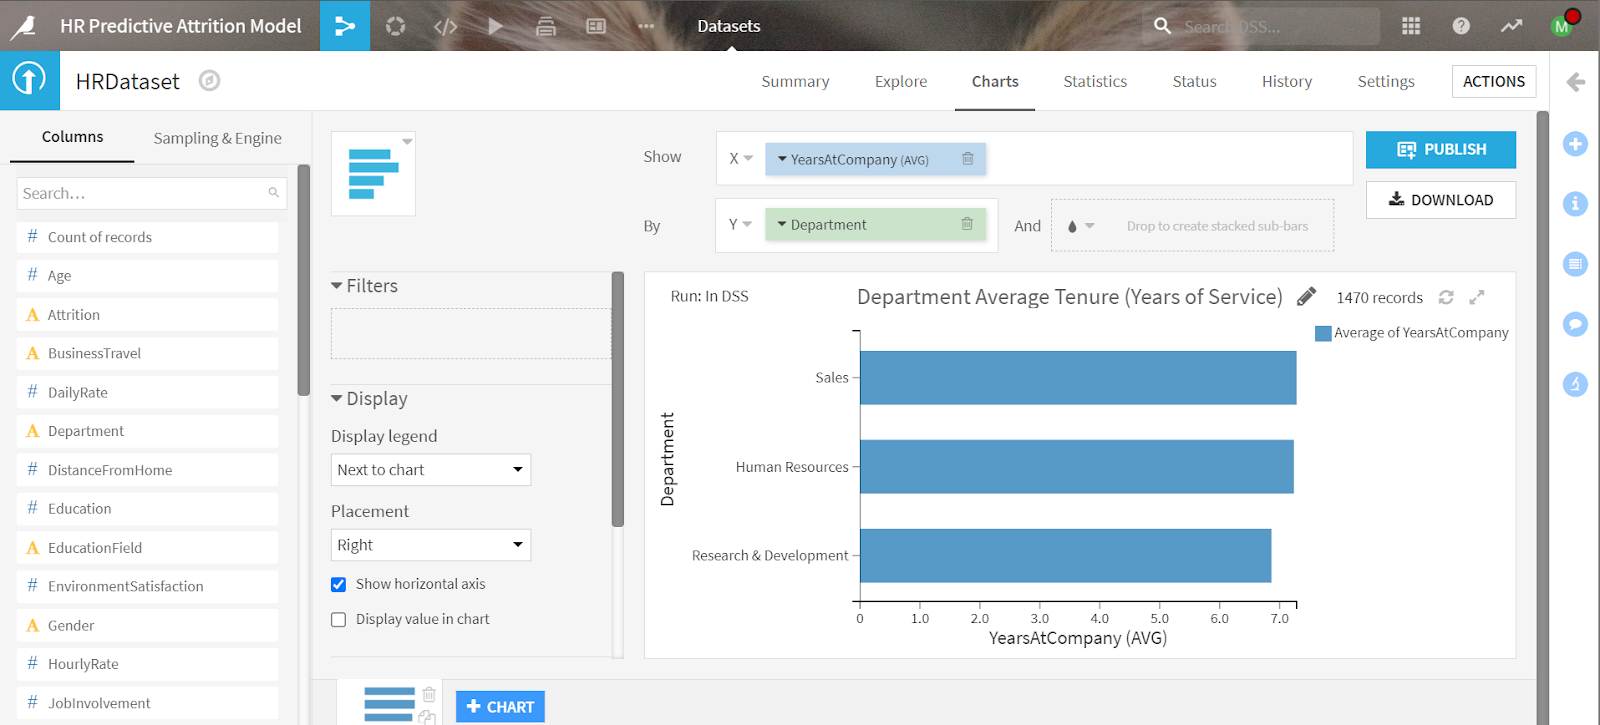
Charts/Visualizations: Visualizations can enable users to explore and build a fundamental understanding of the data to inform model design choices quickly. Choices like: should the model include time of year? Is there a seasonality effect on turnover rates?
2. Data Modeling
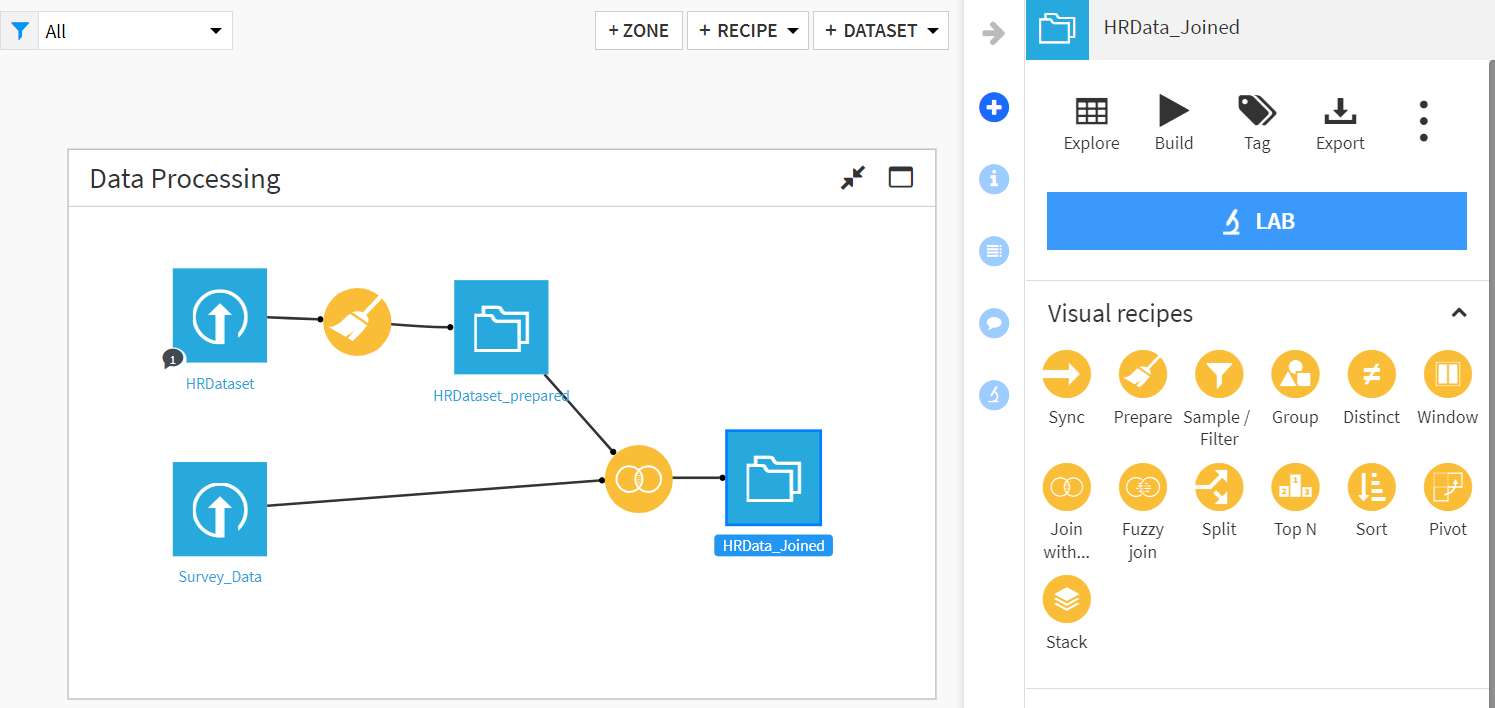
Dataiku uses drag-and-drop functions (‘visual recipes’) to perform certain processes on data in a linear fashion. If users previously created data processing pipelines in other projects, they can build additional steps by leveraging existing work, ensuring consistency and transparency across projects and speed in development. This saves on the most time-consuming tasks in developing an attrition model including data cleaning, data pipelining, and processing.
Visual Recipes: Drag-and-drop components are designed to do one function to the data (join, group, prepare/clean), allowing users to have a visual representation to clearly understand what is happening to the data.
Code Recipes: Functionality via coding with Python, R, SQL, or Shell. This extends a user’s ability to execute on their organization's data needs directly within Dataiku and without the need for additional technologies or servers. Create new variables, clean data outliers, and more.
Plugins: A mixture of visual (no-code) and coding recipes created by developers to achieve tasks like exporting data to Tableau, connecting to API data sources, processing data for time series forecasting, and much more. The possibilities of a plugin are as open as the developer’s ability to code. Organizations can make their own private plugins to provide consistent results across projects, adhere to organizational standards, and reduce redundant work for future attrition modeling.
3. Productionization
Dataiku does not separate the testing and development from the data engineering of your attrition model pipeline to make it production ready. The effort users put into developing an attrition model will be the same work used to roll out the model into an organization. This saves significant time by not requiring a data engineering phase requiring data engineers, additional servers, and cloud resources.
API: Dataiku has a hosted API node dedicated to making attrition models scalable and accessible to systems within and outside of Dataiku. The API allows your organization to incorporate real time predictions of your attrition model in other tools like Workday, Rippling, or other HRM tools.
Batch Output: Users are able to schedule batches of data to receive predictions and output results to files (csv, Excel, etc.) or directly back to the database. Having batched inferences allows organizations to build tools like dashboards to help leaders make informed decisions about employees at risk of leaving.
Connectors: Dataiku has the ability to access non-database data sources like HubSpot, APIs, and more to give users access to supporting data no matter where it is located. This allows your organization to productionalize difficult data sources directly into a model.
Transparency
Unlike creating an attrition model using code (Python/R/Javascript), Dataiku users are able to document, develop, deploy, and monitor in a way that is transparent to both technical users and business stakeholders. Dataiku provides project transparency to all stakeholders, independent of their license type, and can be baked into each component in Dataiku.
Transparency helps increase the speed of development, especially in cross-disciplinary projects where model transparency has historically been a pain point for stakeholders. Transparency is baked into the platform with text documentation, dashboards, and plugins to monitor model drift visually. Dataiku has many features and capabilities that help drive transparent project execution.
1. Text Documentation
Within an attrition model project, developers and stakeholders can document steps, resources, and decision reasoning through Wikis to keep track of To-Dos and maintain discussions at the project, zone, or recipe (function) levels. Documentation at the project enables your organization to efficiently retrain the model in the future.
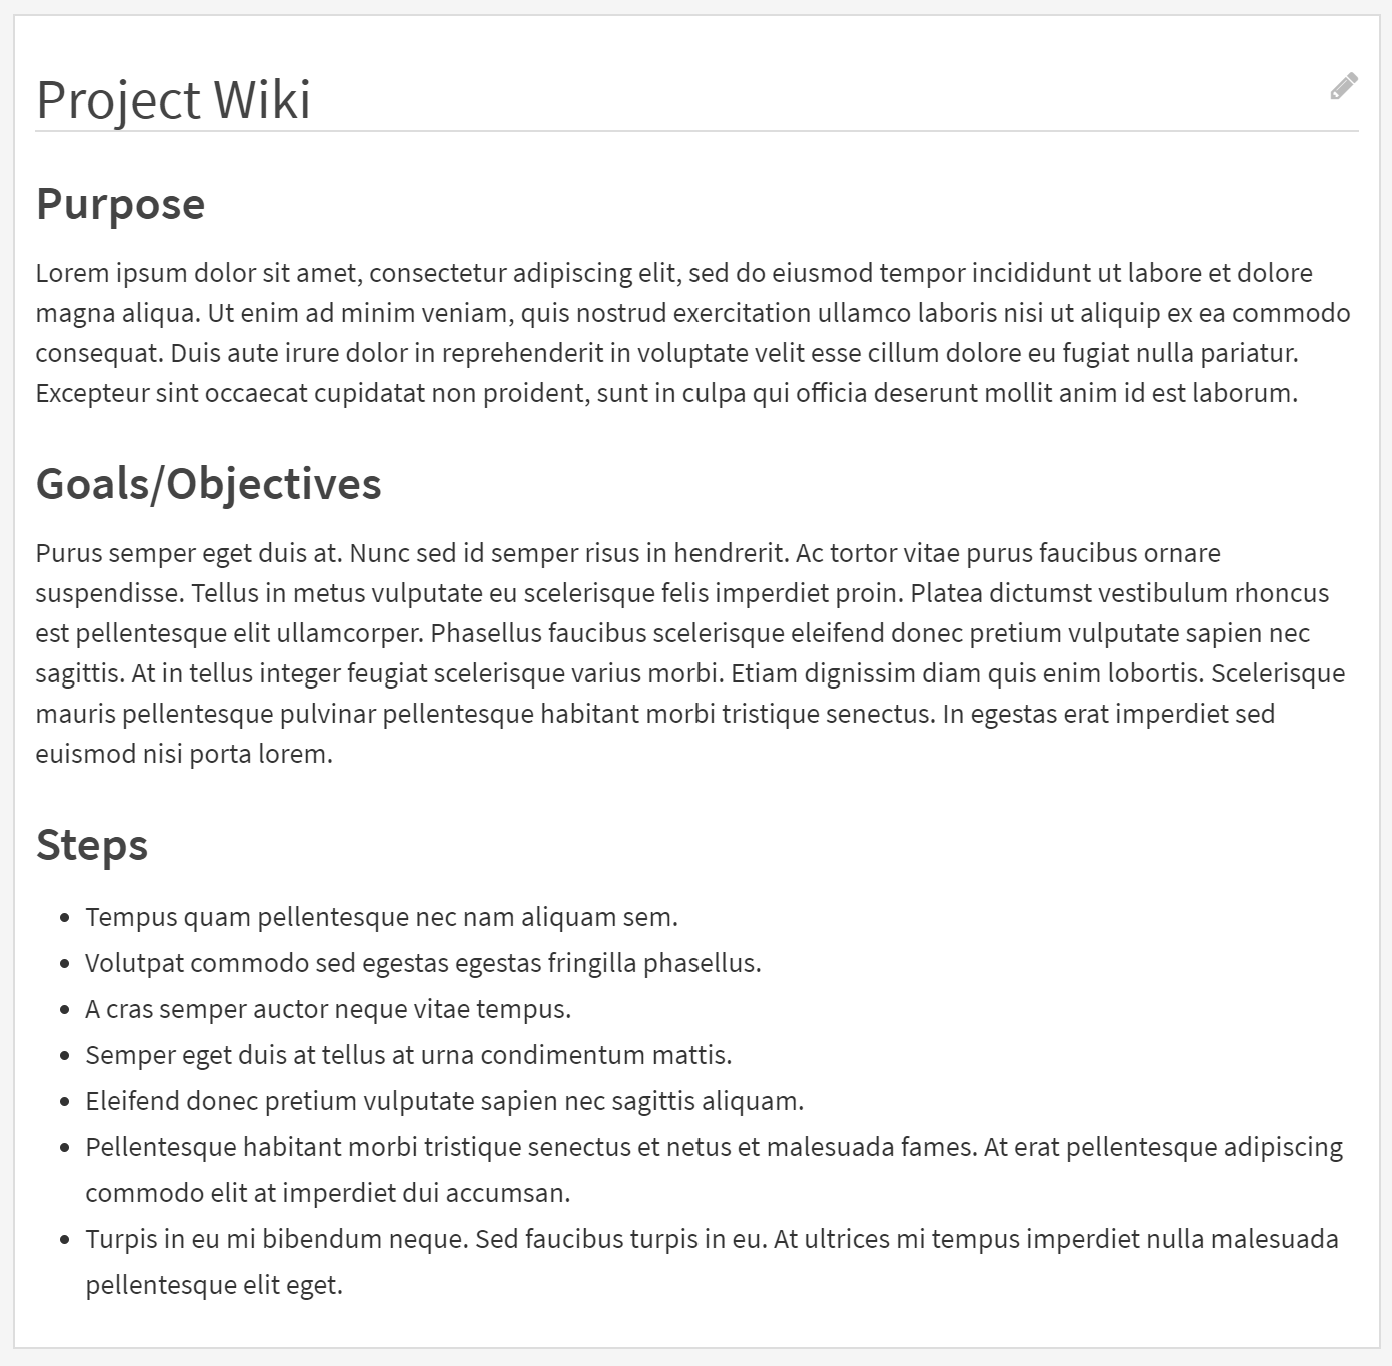
Wikis: Can be found at the project, zone, and recipe level and allow users to document changes, reasoning, and anything pertaining to the project or step being referenced. Use this functionality to make clear the purpose, objectives, and steps taken when creating the project to improve ease of future users responsible for retraining the model.
Project Wiki:
To-Dos: A tool to integrate outstanding actions with a team working on an attrition model project driving aligned stakeholder engagement and project transparency. They are integrated at the project and recipe levels and allow users to check off high-level to-dos in the project and create their own to-dos for each step in the data pipeline. This is especially helpful when working on an attrition model with cross-disciplinary collaboration or multi-person teams by instilling accountability and transparency for faster development.
Discussions: Allow users to create topic threads to collaborate, ask questions, and document choices along the way providing centralized transparency to a project across data practitioners and business stakeholders at the project, zone, and recipe levels. This helps to ensure discussions on key attrition model decisions are captured which may have been held offline.
2. Dashboards
From development through deployment users can create dashboards in Dataiku to analyze attrition model variables, share relationships in the data, and monitor leave trends. This helps the development team to share a story with data-driven decisions behind choices in developing an attrition model. Share this with business stakeholders directly by allowing access to a collection of dashboards built in Dataiku or export your data directly into Tableau or Power BI to visualize in existing BI platforms.
3. Model Drift Plugins
Model drift is the reduction of the attrition model to reliably predict the probability of an employee resigning in a given time frame as behaviors and expectations change. This is extremely important to monitor and will serve as a queue for when your team should retrain the attrition model after an acceptable amount of drift has been exhausted. This functionality is traditionally clunky to monitor with deployments in Python or R. Dataiku has a plugin that can easily add this functionality visually to your model to be monitored over time.
Key Takeaways
Despite an unprecedented year of high voluntary employee turnover, turnover will always remain a high cost to an organization. Attracting and retaining talent relative to competitors is a significant advantage for an organization enterprise-wide. The retained knowledge, reduced cost of onboarding and training, increased employee loyalty and engagement, and greater team cohesion and collaboration that comes with reduced turnover is an important goal to constantly drive toward.
Data, HR and business knowledge, and up-to-date attrition models can provide organizations with ongoing relevant insights. In turn, these insights allow your organization to more effectively drive employee engagement, meet changing employee needs, and retain valued employees. If you are interested in exploring how attrition modeling can be implemented in your organization to support and meet your unique needs, contact DataDrive!