Google Analytics is so seamless that users rarely consider running the analytics themselves. But the advantages to building custom tools to analyze web logs are numerous, including the ability to keep data private and access very specific metrics.
What Are Web Logs?
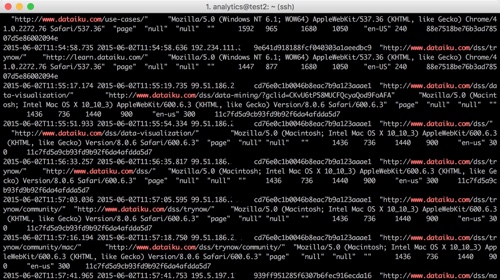
In web logs, as shown in the picture below, each line (or record) represents a user’s action (e.g. opening a page, an error that occurs, or something else) typically with the following information:
- Date and time of the action
- User’s IP address
- Details of the action
- Diverse information on the context (user-agent, etc.)
From this fairly raw data, which is often stored in flat compressed files, the aim is not to calculate a descriptive statistic, such as the number of visitors per country or the conversion rate. If this is the goal, Google Analytics or Matomo are very good tools. There is some time and complexity cost to build a custom model, so mimicking an off-the-shelf product can be wasted effort. It's better to save web log custom analytics to resolve advanced problems that are specific to an organization's business context, such as client segmentation or product recommendations.
However, these analytics don't need to be as complicated as the logs would suggest — as a little demonstration of Dataiku’s data preparation features, we built a simple web log analytics tool that can provide custom analytics with minimal effort. Best of all, the project is explorable on a browser, no download required.

Don't Waste Time on Data Cleaning
The obvious first step in a web log project is data preparation. For example:
- Filter and retain certain actions
- Identify (or split) dates and make use of them (differences between two dates etc.)
- Clean missing or abnormal data
- Geographically locate the IP address
- Work with certain values such as the user agent of a navigator
- Categorize certain actions (from the URL, for example)
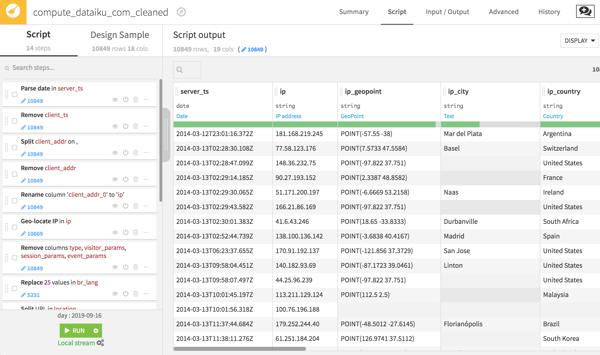
But instead of cleaning data with repetitive code, these steps can be carried out with a visual preparation recipe in Dataiku.
NOTE: Analyzing real web log data carries compliance restrictions to protect users' information. For this model, randomized datasets are used.
Two of these cleaning steps are worth highlighting. The first is a geolocation processor with which extracts all sorts of geographical information, from country all the way down to latitude and longitude, all from a user's IP address.
The second is the URL-splitting processor, which extracts the path to see what specific pages on the website users are visiting.
Grouping Data
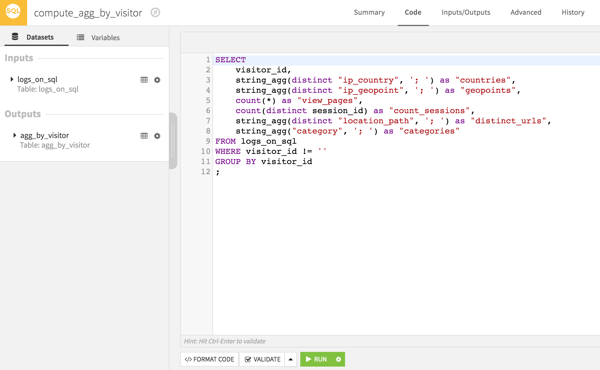
The second stage in this is analysis is the reduction of user dimension. Instead of a list of individual actions that all users performed, this gives developers visibility into the behavior of each user. This is critical to feed into data visualization, or machine learning models.
Visual recipes or code can create a "summary" of the user in question. A few examples of variables obtained for each user:
- Number of actions
- Dates of the first and last actions
- Counts of occurrences of some actions (more advanced: count of occurrences through a sliding time window)
- Statistical indicators of actions or their associated values (means, quartiles, deviations, etc.)
While this can be done visually, pushing the calculation to SQL is much faster and more efficient; a SQL base, a Hadoop cluster, or a Spark cluster (via Hive or Impala) are all valid options.
Visualization
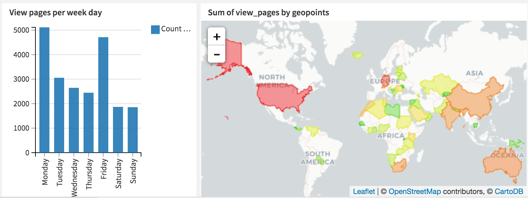
Dashboarding helps promote understanding, as it visually describes the underlying data. For this project, the dashboard contains four charts highlighting different facets of the data. The next step would be to automated dashboard updates to ensure that the most relevant insights are on display.
Other Web Logs Use Cases
Organizations that wish to leverage their web logs to fuel machine learning models usually fall into the following use cases:
- Optimization of conversion (sales, downloads…)
- Working on recommendations, that is to say suggesting products or content that has the greatest chance of suitability
- Calculating client satisfaction scores or the risk of churn
- Segmentation of behaviors
- Detecting suspicious behavior
These use cases will generate increased value compared with descriptive analyses. The automation of these models usually generates some pretty cool uses such as personalized emails or up-to-date scoring in CRM that the marketing team can use in their daily work, etc.


