


To facilitate full systemization of data and AI, it is important to allow as many users to access, interact with, and gather insights from relevant data as possible. Many existing processes only allow IT administrators or analysts to extract data from databases or data warehouses and users who are not familiar with SQL face challenges in extracting and analyzing the data they require for their business needs. Having a webapp can help to solve this problem and give more autonomy to users from various backgrounds.
In Dataiku, we can create a code-based webapp using standard HTML, Shiny, Dash, or Bokeh. Webapps can be used to write advanced visualizations or custom applicative frontends. This component will present a lot of opportunities for Dataiku power users who are familiar with Python and want to customize their dashboards based on their preferences in design.
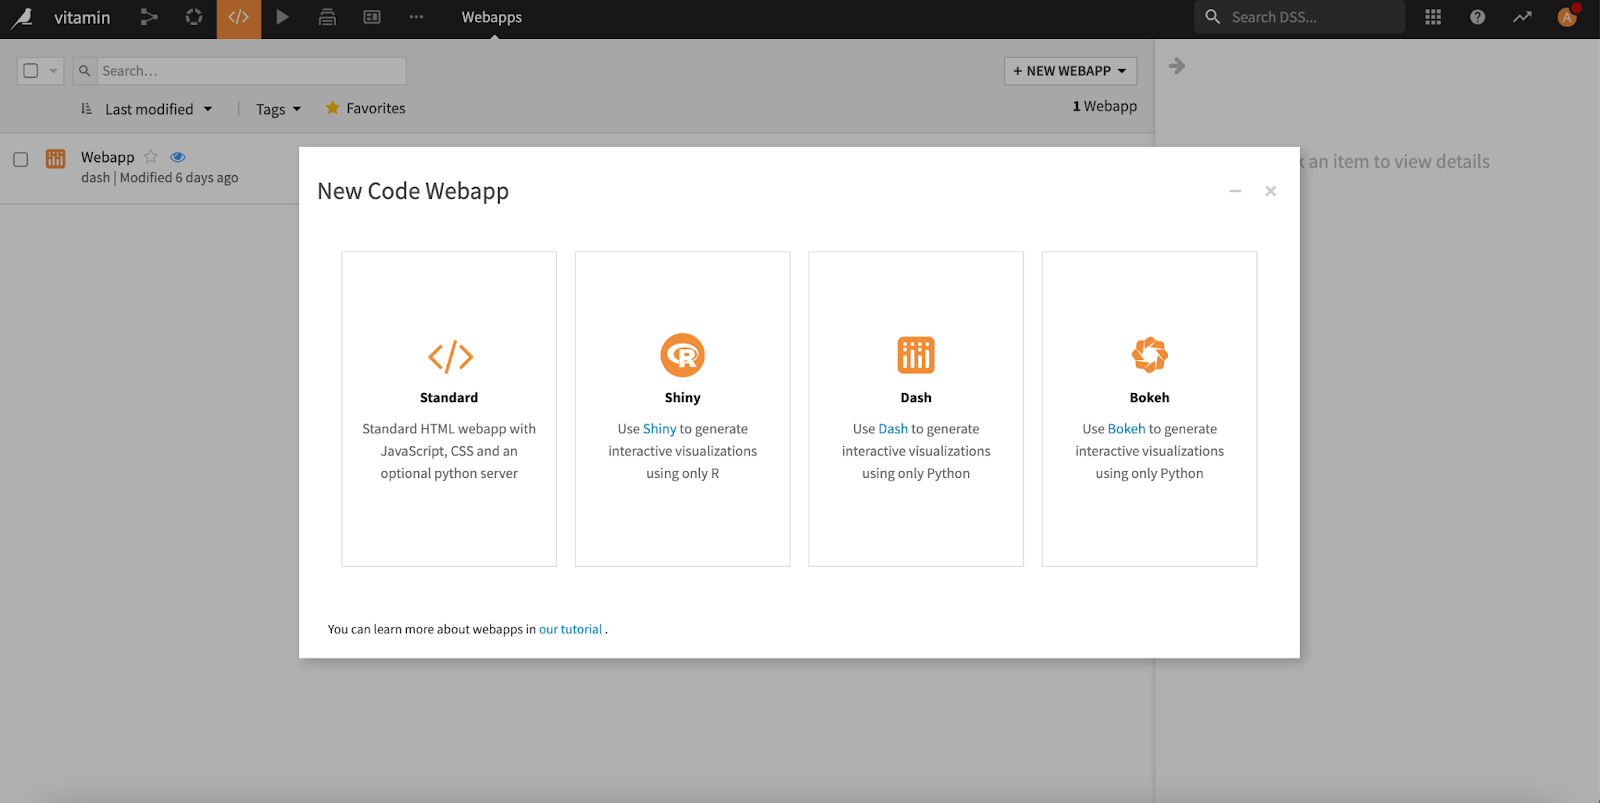
Figure 1. Webapp options in Dataiku
In this example, we will make use of Dash to create a webapp. Dash apps give a point-and-click interface to models written in Python, vastly expanding the notion of what's possible in a traditional "dashboard." With Dash apps, data scientists and engineers put complex Python analytics in the hands of business decision-makers and operators. Dataiku provides us with some code templates to begin with. Over here, we are going to make use of the template “A simple multi-page webapp using Dash.”
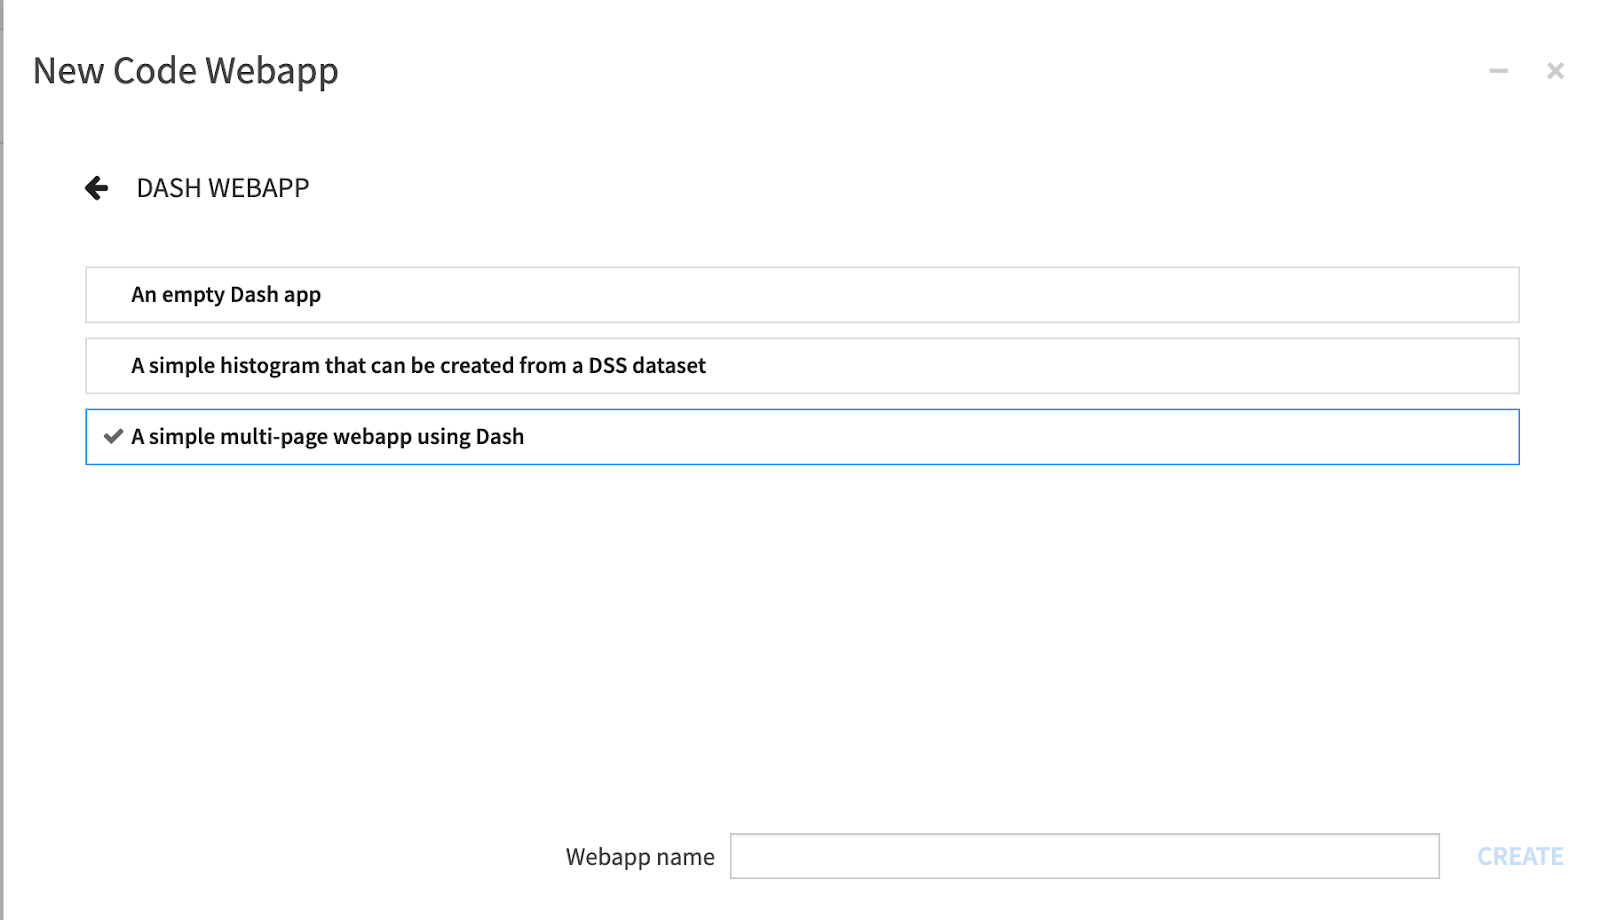
Figure 2. Sample code templates for Dash webapp in Dataiku
Exploring the Healthiest and Most Unhealthy Hawker Foods of Singapore Through a Dash Webapp in Dataiku
If you have been to Singapore, you would know that hawker foods are very popular here. In fact, “Hawker Culture in Singapore: Community Dining and Culinary Practices in a Multicultural Urban Context” was inscribed on UNESCO’s Representative List of the Intangible Cultural Heritage of Humanity on Dec. 16, 2020. Many of our hawker dishes originated from the food cultures of different immigrant groups who settled in Singapore. Over time, they have evolved to become the distinctive local dishes that we love, and they form an important part of our food heritage.
However, it is not obvious which hawker foods are healthier and what some of the best and worst hawker foods in Singapore are when it comes to nutritional content. We want to explore the relationships between different nutritional values for some of the popular hawker foods in Singapore and present the data and analytics in the form of a webapp — for users to easily interact with the data and analytics — in Dataiku.
In terms of the data source, we scraped the data from healthxchange.sg, specifically the name of the food, kcal, protein (g), fat (g), saturated fat (g), dietary fiber (g), carbs (g), cholesterol (mg), sodium (mg), healthy tip, and the url link to the image.
In our webapp, we included the following interactive and analytics capabilities:
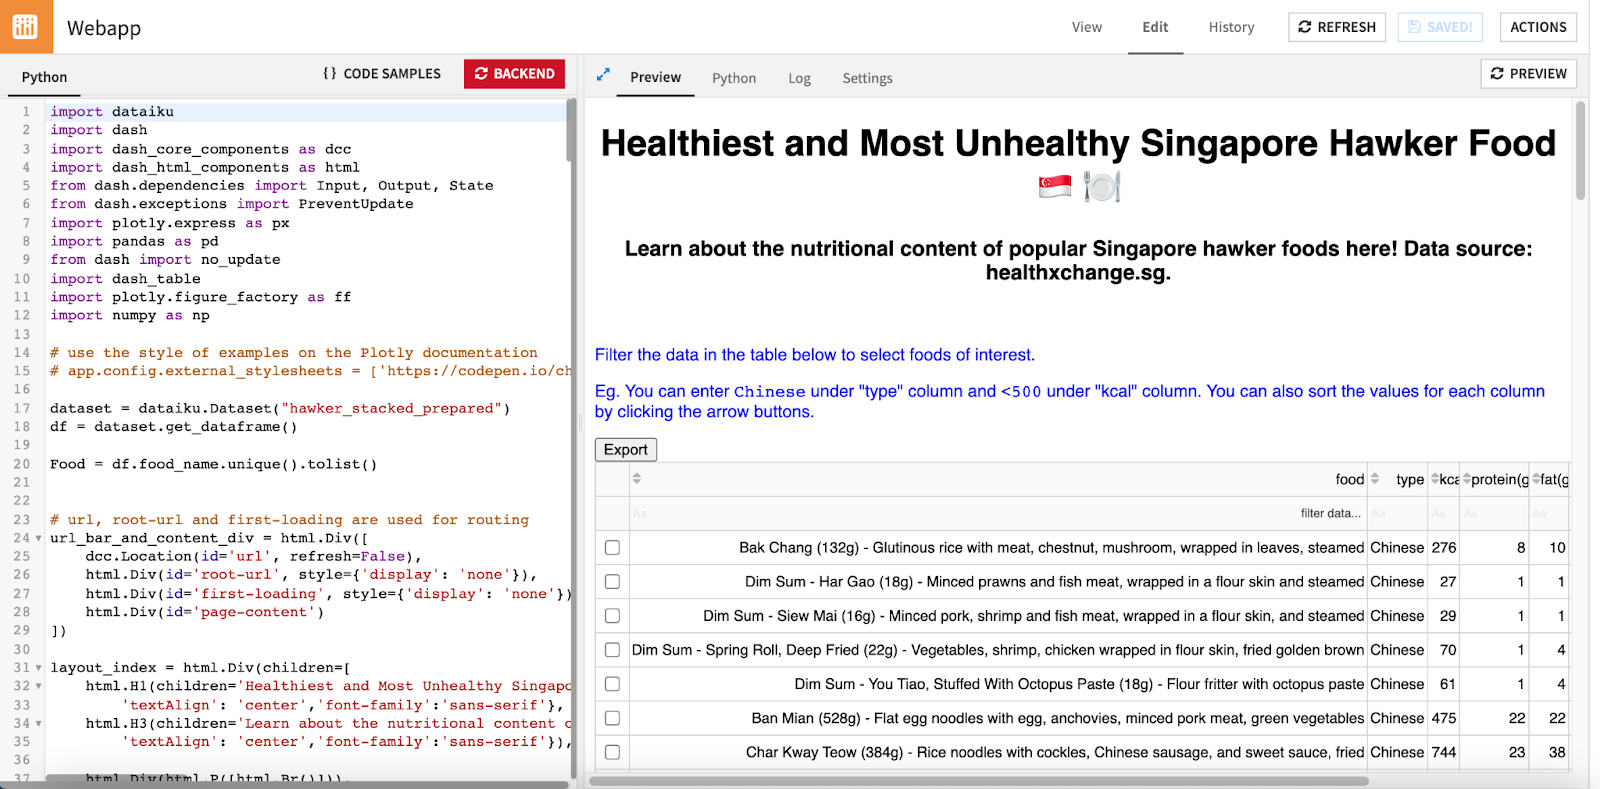
- Data is presented in a data table where users can filter to select foods of interest. For example, they can enter Chinese under "type" column and <500 under "kcal" column. They can also sort the values for each column by clicking the arrow buttons. The bar charts corresponding to each nutritional aspect below the data table will also be updated automatically. Ticking the box next to the food column in the table will highlight the food in the charts (as light blue) for ease of focus.
- Users can choose to export the results to a local csv file by clicking on the “Export” button.
Figure 3. Interactive data table and charts showing 57 hawker foods
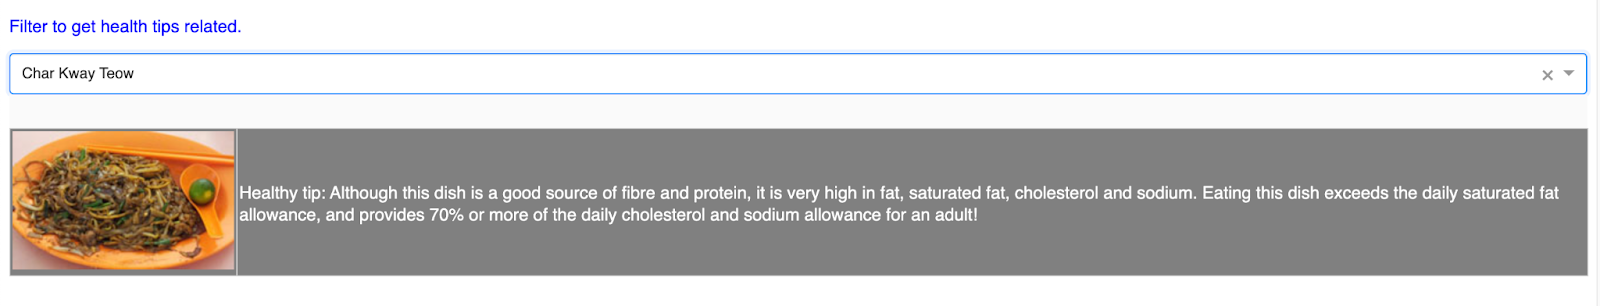
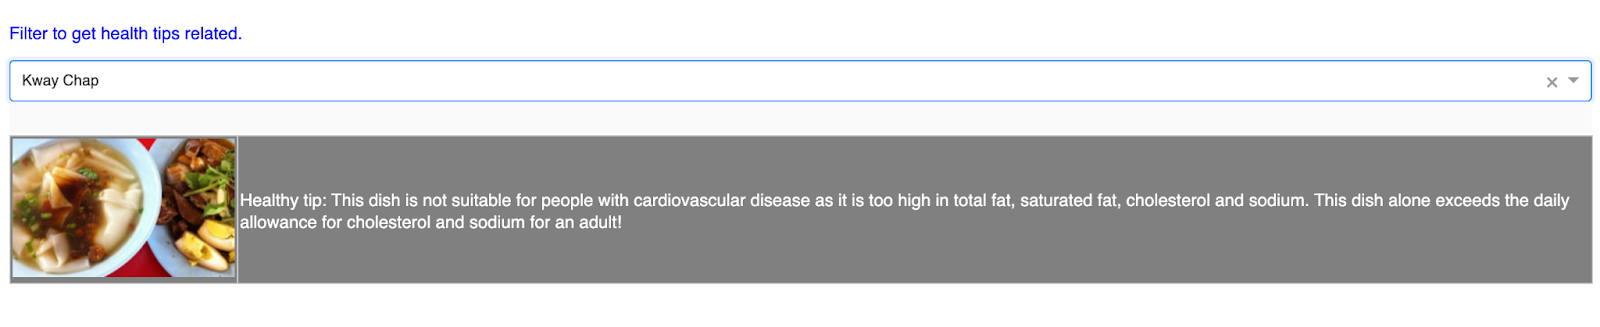
3. A dropdown box is created for users to select the food for which they want to find out healthy tips.
4. A multivariate scatterplot is created to visualize the distribution of foods by kcal, protein, and weight. A normalized version based on kcal and protein per 100g is also developed. Users can hover the points to see what food they are. We have chosen kcal and protein(g) to focus on as an example.
We observed that the top few hawker foods with the most kcal have also comparably high protein content. Even though some foods have a larger serving in terms of weight, they might not necessarily have the highest kcal content. It is interesting to note that after normalizing the kcal and protein by weight, there is a big difference in how the hawker foods rank against one another. But, of course, we probably won’t eat the amount of You Tiao equivalent to one serving of Duck Rice, for example.
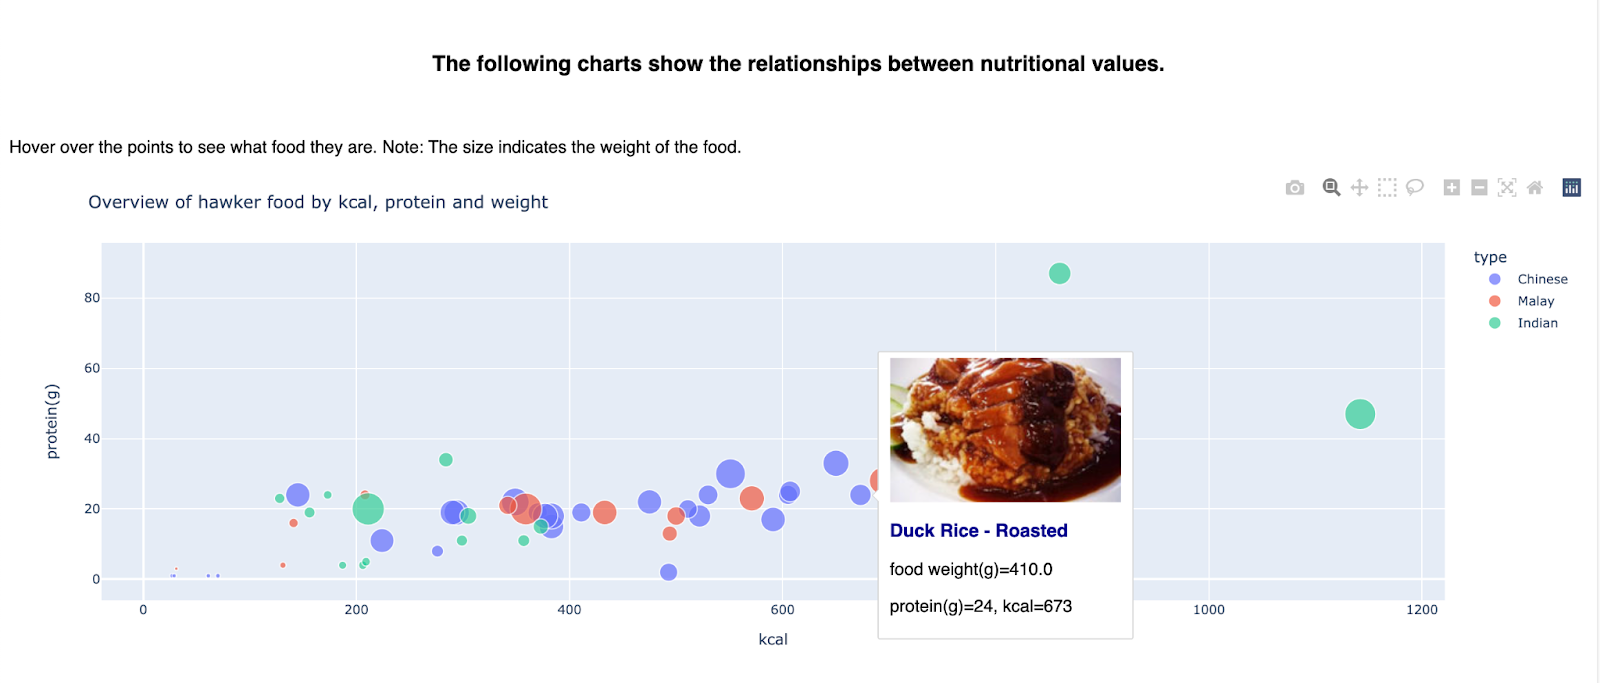
Figure 5. Scatterplot of protein(g) and kcal for the 57 hawker foods, with the circle size representing the weight of the food and color representing the type of food
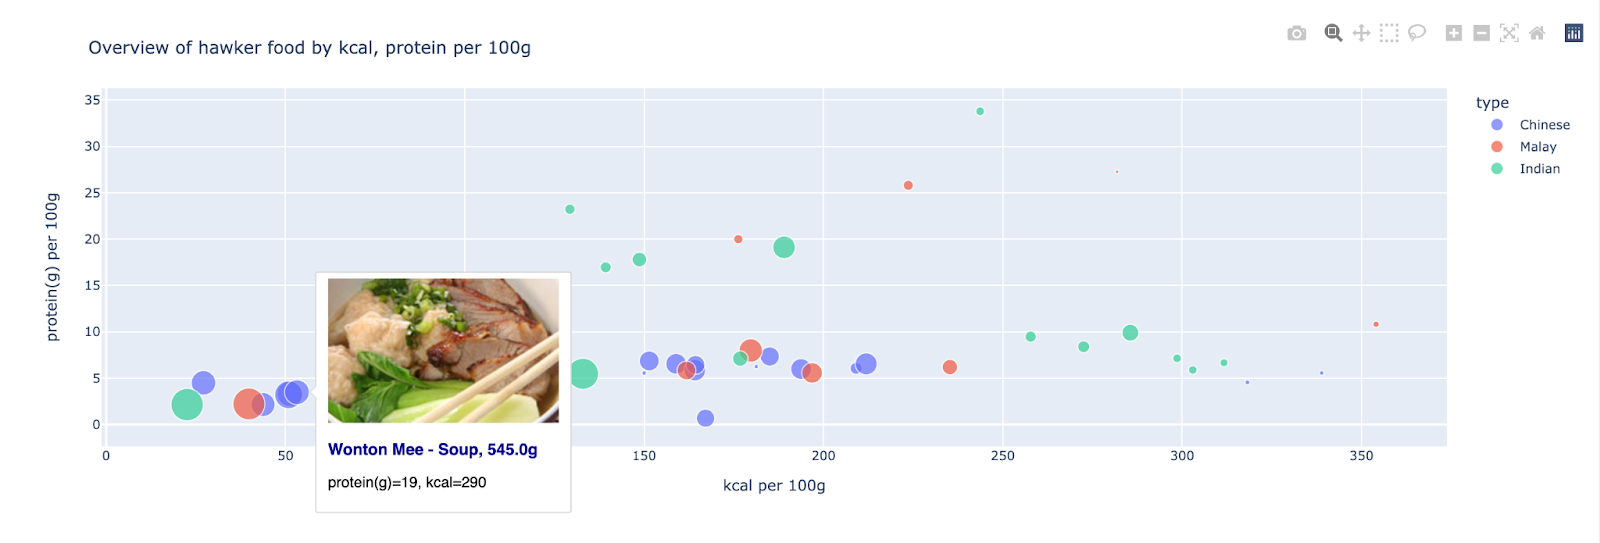
Figure 6. Scatterplot of protein(g) and kcal normalized by weight for the 57 hawker foods, with the circle size representing the weight of the food and color representing the type of food
5. A scatterplot matrix is further added to display the relationships between all the nutritional content against one another. From the chart, we can see some outliers for some of the pairwise combinations. For example, Porridge with Minced Pork and Century Egg, and Kway Chap have a much higher cholesterol content compared to the rest of the hawker foods given the amount of other nutritional contents it contains, while it is the opposite for Fishball Noodle - Soup, Mee Soto, and Prawn Mee, which have a relatively lower cholesterol content compared to the rest considering the amount of sodium it has.
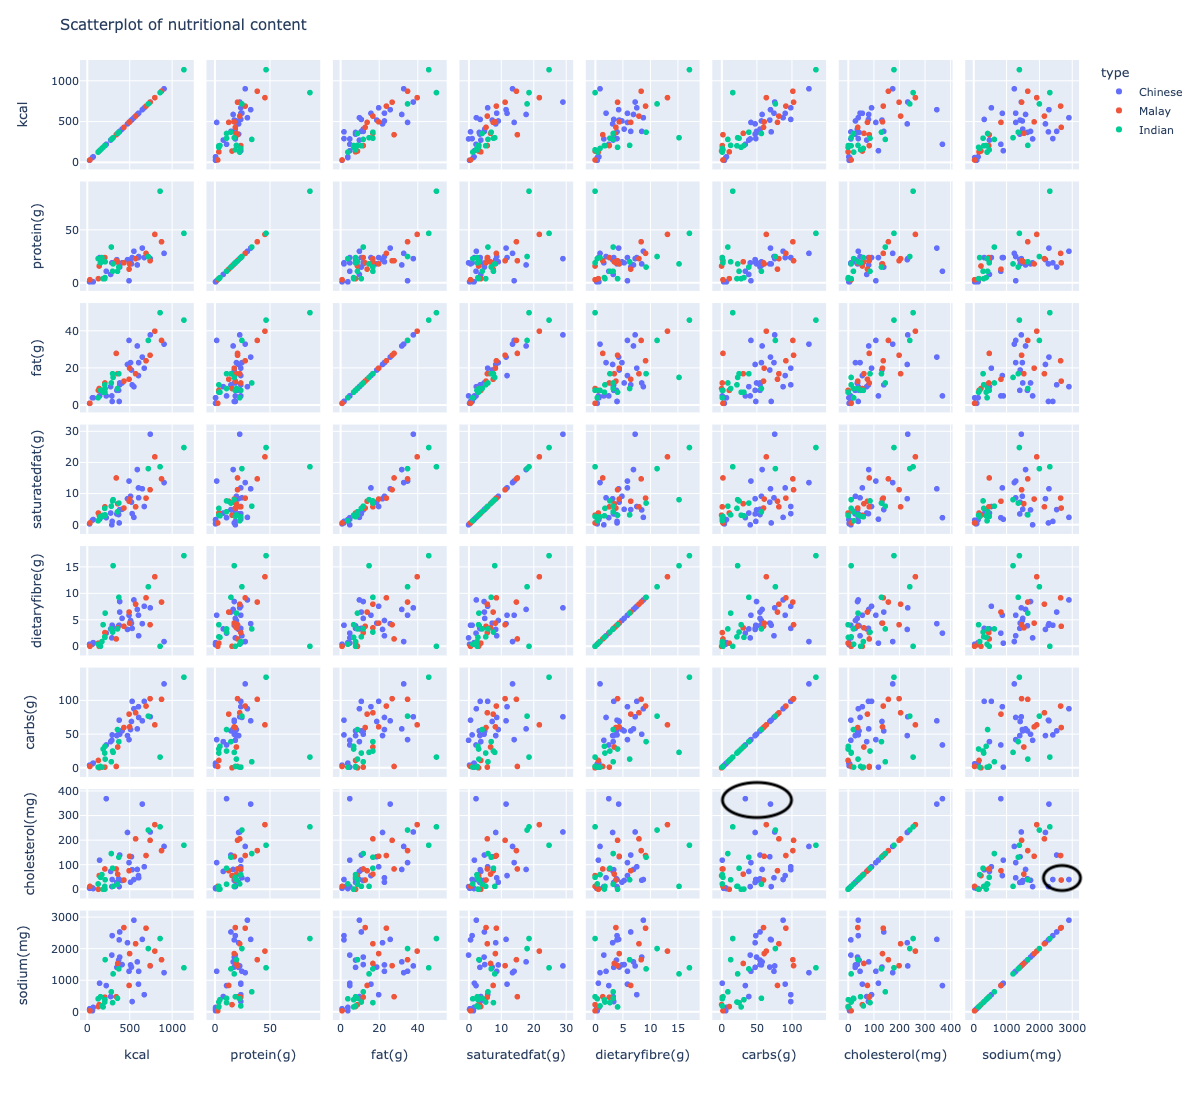
Figure 7. Scatterplot matrix of nutritional contents of the 57 hawker foods, with color representing the type of food
6. To quantify how strongly correlated the nutritional contents are against one another, a correlation matrix is developed. We can see that only fat and carbs are strongly correlated with kcal, and fat with saturated fat, while the rest of the nutritional contents are not very strongly correlated with one another.
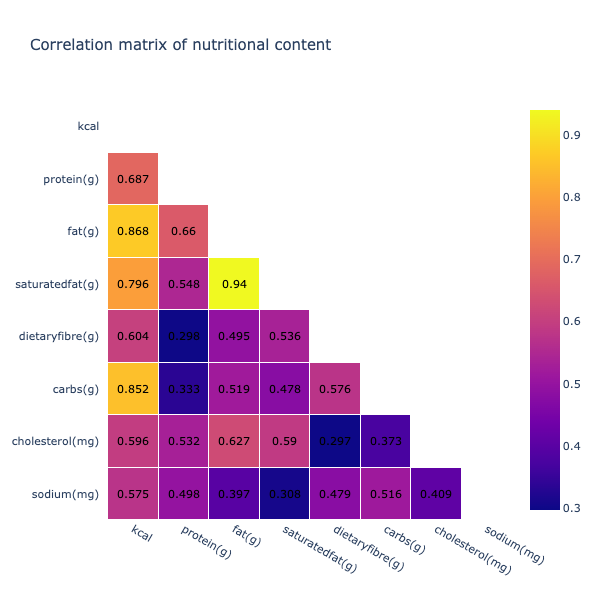
Figure 8. Correlation matrix of nutritional content for the 57 hawker foods
The below shows a screenshot of a part of the code underlying the webapp and how the webapp development interface looks like within Dataiku. In the Dash code, apart from developing the interactive components, we can customize the type, size, color of fonts, as well as size of charts.
Figure 9. Webapp development interface within Dataiku showing code and preview of app side-by-side
This article demonstrates some features that can be done using Dash. If you’re interested in doing something similar, you can learn how to create a simple Dash webapp in Dataiku over here.