


Predicting customer churn is a classic use case for machine learning: feed a bunch of user data into a model -- including whether or not the users have churned -- and predict which customers are most likely not to be customers in the future. Armed with this knowledge, you can take measures to address those at-risk customers before they cease to be your customers.

Predicting a single variable (in this case, whether a customer will churn) is what is called supervised machine learning. Unsupervised learning is when we’re not looking for a single variable; the most common type is cluster analysis, where an algorithms finds underlying patterns in order to group the data. Using unsupervised learning as a step in predicting a variable isn’t necessarily obvious, but this sample project in Dataiku combines these two types of machine learning, and it does so without using a single line of code.
As part of our sample gallery of projects, this project lets you explore Dataiku hands-on without downloading anything. Dataiku lives completely in your browser, so dive right in: you’re a telecom operator, and, as you might guess, you’re trying to predict which of your customers might churn. Start by looking at the flow, which lays out all the datasets, transformation steps, and models used in this project. You see that we start with two datasets: the first includes customer data, with their plan details, phone usage, number of customer service calls, and other fields; and the second has the same fields as the first, except with one extra field conveying if the customer has churned or not.
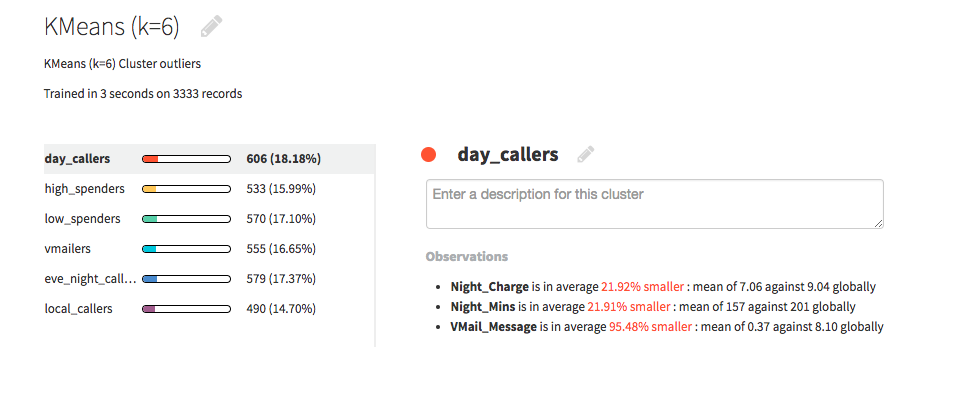
Click on each cluster to see the automatically generated observations.
After some simple data preparation, we run our cluster model on the second dataset. We choose to create six clusters, and we’re able to name these clusters based on the automatic observations generated through Dataiku. For example, the first cluster has nighttime calls and charges 22% lower than the average, so we call them “day callers.” Another group is made up of 100% voicemail users, while only 28% of all customers use voicemail, so we call them “vmailers.” These automatic observations make it much easier and faster to understand and label our clusters.
We then apply the clusters to each of the datasets, and we’re ready to move on to the supervised machine learning step. We use a random forest model and train it with the labeled dataset (the one where we know whether the customers churned or not), and we are able to use the clusters as features. We can dive into the model to see which variables are the most important, and then we can score the unlabeled dataset to generate our prediction.
Looking at the dashboard, we see that one of our clusters ranks as one of the most important variables in our model. Not bad! Take a look for yourself, or just download Dataiku and use your own data to make some predictions.