


The concept of data democratization across the enterprise (meaning putting data into the hands of the many and not just the elite few, like data scientists or even analysts) is a big part of what we do at Dataiku… but it’s actually restrictive. Why? Well, because the story is actually much bigger than that. We need to go beyond widening the circle of those who use data and analytics to perform their day-to-day jobs (i.e., data scientists creating, developing, and deploying machine learning models, analysts performing a complex analysis) and include those who are consuming those models and insights.
At Dataiku’s 2021 Product Days, Katie Gross (Lead Data Scientist) and Jeremy Greze (Director of Product Management) led a session on consumable AI in Dataiku, which enables these stakeholders to:
- Engage seamlessly with AI systems in the context of day-to-day work as a part of existing workflows, tools, and technologies.
- Use dashboards that automatically update with the latest data for accurate KPI and value tracking.
- Get predictive insights with custom visualizations and applications to make better everyday decisions.

Here, we’re going to break down three different components of Dataiku and highlight how they foster the consumption of AI by both technical and non-technical stakeholders.
1. Dashboards
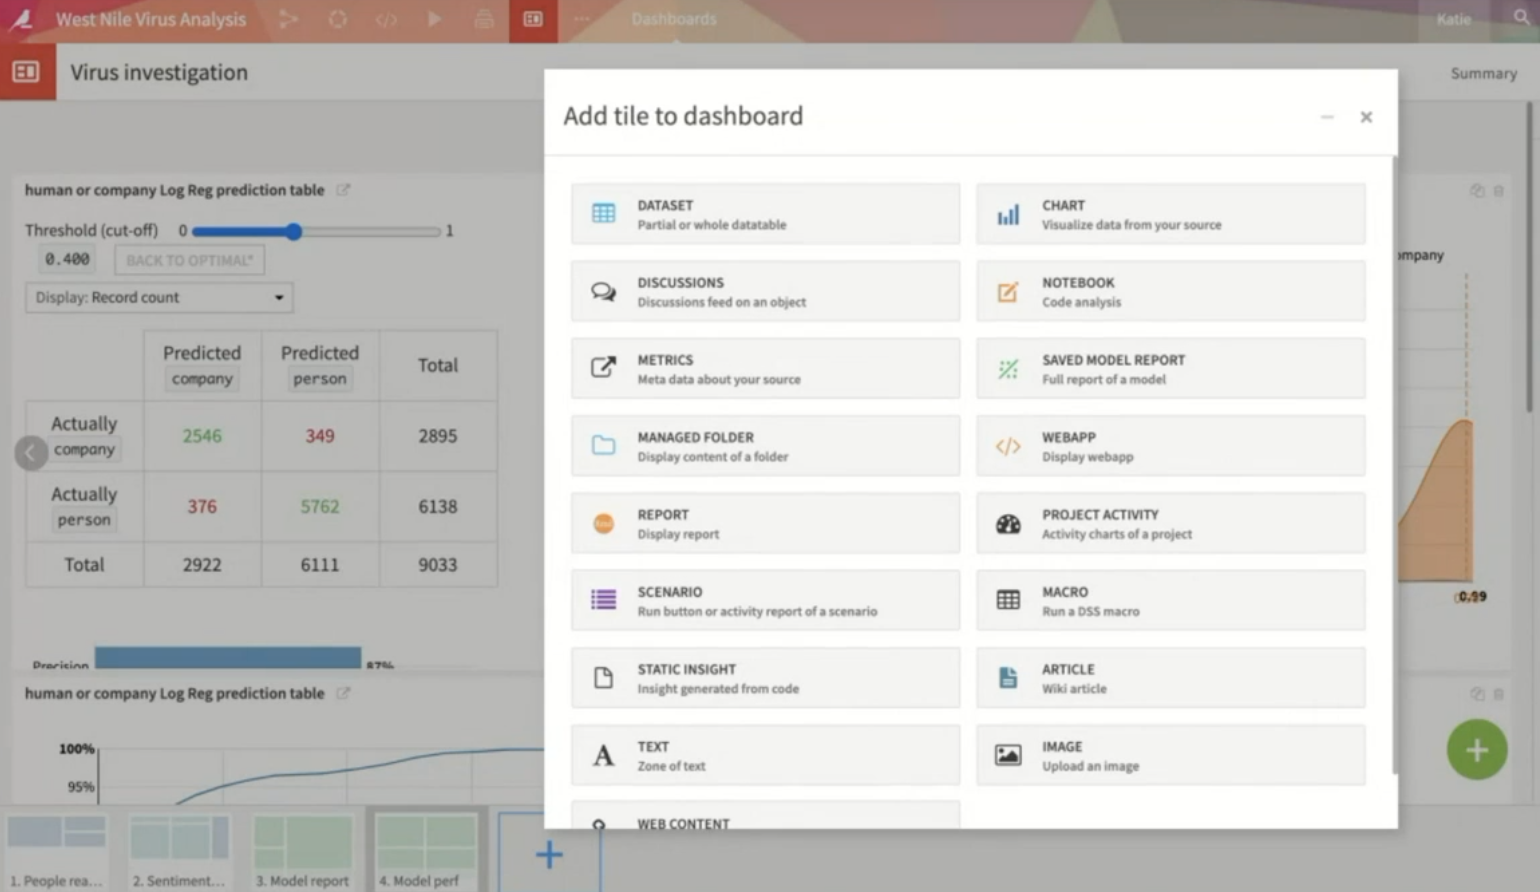
Dashboards allow data analysts and data scientists to share elements of their project either with other data practitioners working on the project or with users who don’t have full access to the project (like an executive). In Dataiku, dashboards are made up of one or more slides, which each consist of tiles. Some examples of tiles include charts, metrics, and text, but they can actually include much more advanced features such as webapps, model information (i.e., parameters, model features, performance) and static insights, which are visualizations created in code notebooks or recipes, with support for a variety of Python and R libraries. This capability allows users to generate visualizations beyond what is available natively through Dataiku.
Further, a data practitioner can add components of their analytics project to a dashboard, even if they don’t have edit access to the entire project. Separately, project owners can grant other users read-only access without giving them access to the rest of the project. In this instance, a dashboard consumer can either log in to Dataiku to interact with the dashboard and its contents in a more interactive fashion or s(he) can export the dashboard as a PDF, JPG, or PNG for a more static view (or to share with colleagues on a wider team).
2. Webapps
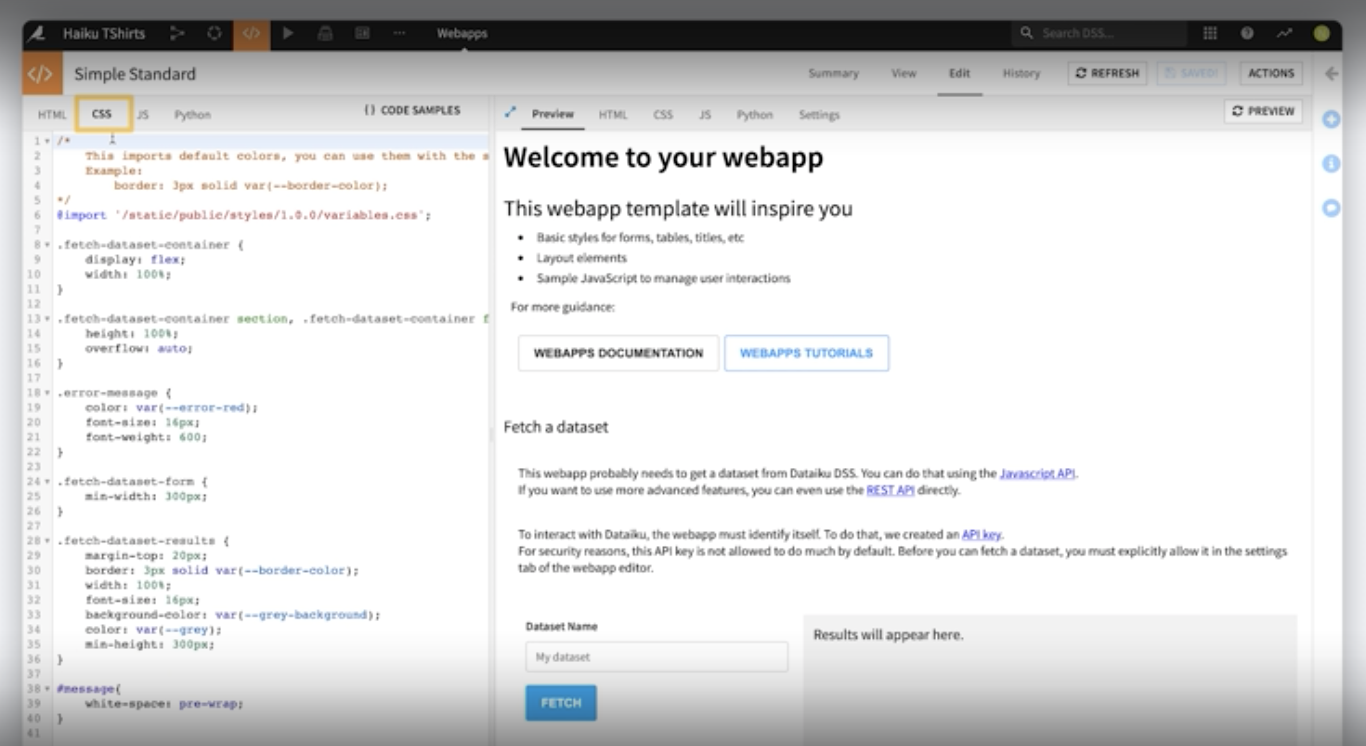
Webapps are another great way for data scientists to share insights more broadly, especially when interactivity is important. They are custom applications hosted by Dataiku, enabling users to extend Dataiku’s native visualization capabilities. Webapps offer advanced visualizations beyond what is available in Dataiku charts (and more charting interactivity) as well as custom applicative frontends (i.e., maybe the data scientist has built a model and wants to make it easy for end users to input parameters and see predictions or charts).
Once created, webapps can then be embedded in dashboards or stay as they are. There are four key types of webapps:
- Standard, which are made up of HTML, CSS, JavaScript, and an optional Python backend
- R Shiny
- Python’s Bokeh and Dash libraries
All of these webapp types can be written in the Dataiku webapp editor, enabling users to write their code as they would outside of Dataiku. Dataiku also takes care of hosting the webapps, but they can be shared with users who have read access to a specific project or publicly with non-users. A code webapp can be developed as a plugin and, ultimately, available as a visual webapp for non-coders. To develop a webapp, users can start from scratch or from a template.
3. Applications
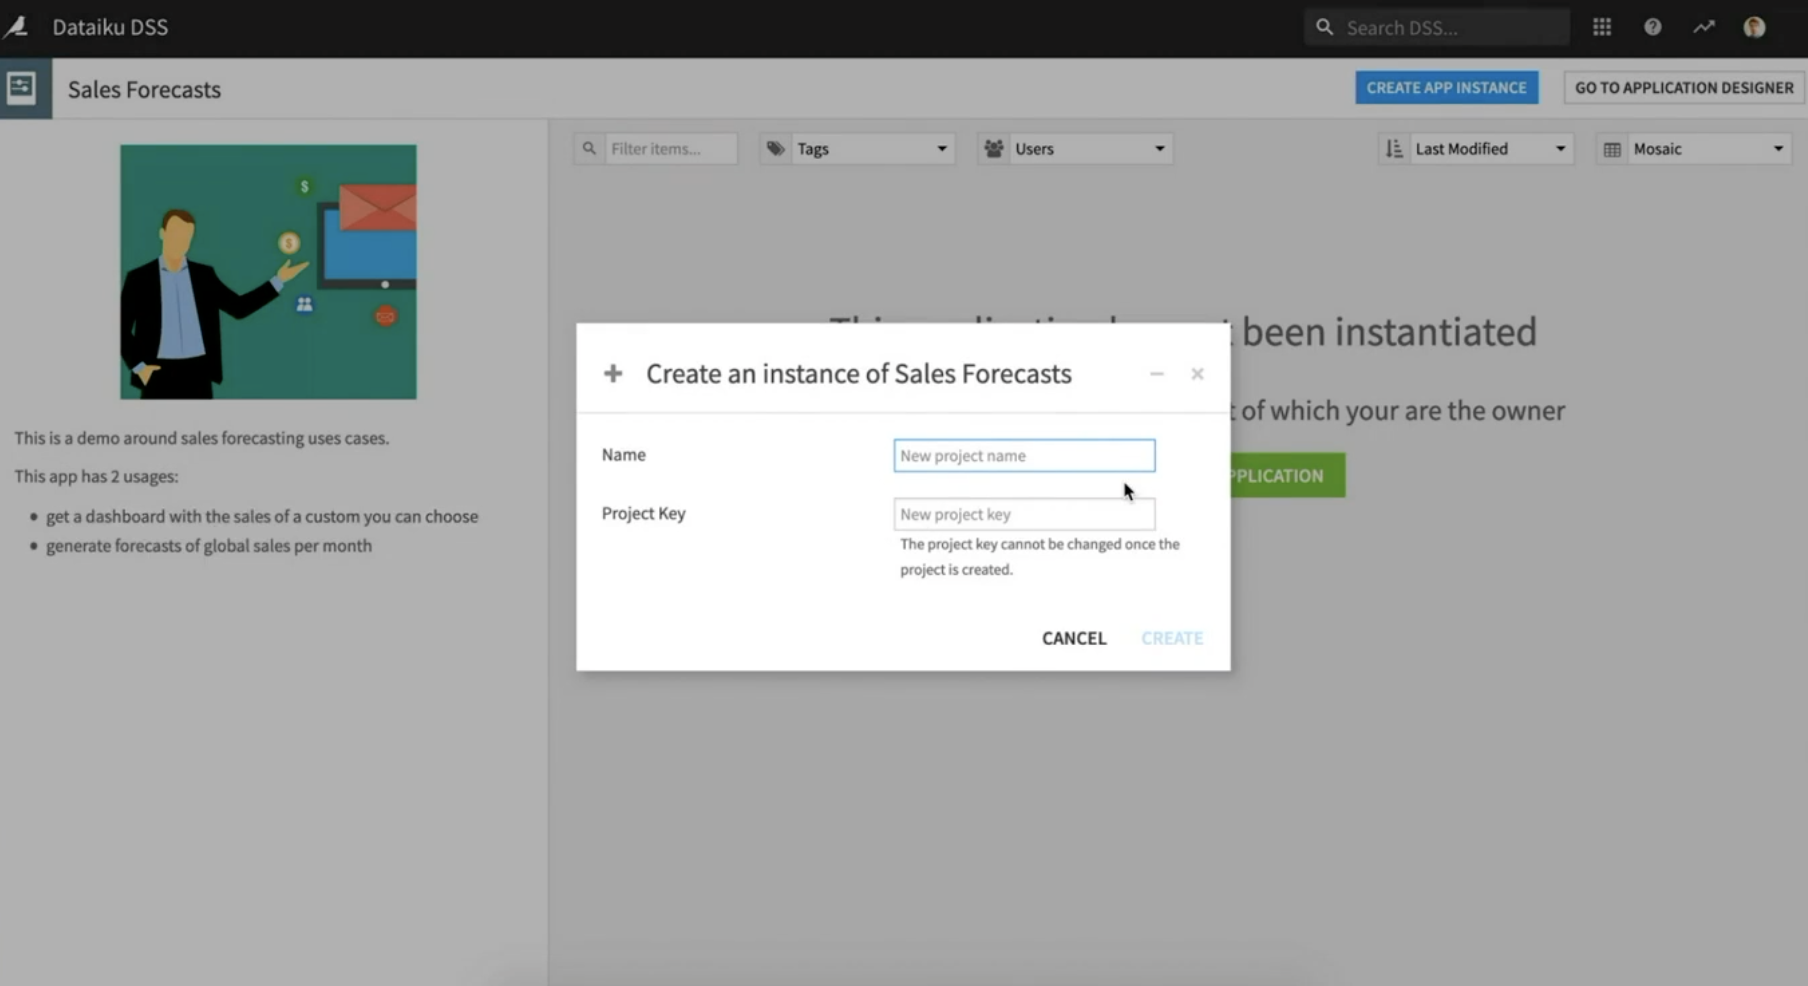
Dataiku applications help organizations grow the impact of AI across their teams. Business users and stakeholders can generate their insights by using a catalog of self-service applications. These applications leverage projects created by data analysts and data scientists, reusing their expertise and the technologies they use.
For business analysts, the Dataiku applications are hassle free because:
- They get a visual list of available applications with a description.
- The application is a single-page interface with visual fields to set parameters, run the app, and get results.
- No technical knowledge is required and the generation of insights is straightforward.
For data experts, the Dataiku applications help them package and share their projects to potentially hundreds or thousands of users. A visual application designer is available to create the UI that the business users will use and an application can package any Dataiku project (containing visual recipes, code, models, data, etc.). The applications run isolated, so there is no risk of conflict with concurrent users or users breaking things. Finally, applications are usable by all, which hopefully reduces the burden on data scientists (and helps make consumable AI more commonplace).
As evidenced by these three key functionalities, Dataiku enables business users to consume reports, generate insights, and draw business conclusions — all without the need to fully understand or interact directly with the project flow.