If you have heard of CI/CD, are (or will be) using Dataiku DSS, and are wondering whether the two make sense together, you are in the right place. In this article, we will review the basics on CI/CD and cover all the topics that require special attention. Note that it goes hand-in-hand with our knowledge base entry, Building a Jenkins pipeline for Dataiku DSS, which shows step-by-step how to apply the concepts introduced here.
In order to be at ease when reading this post, we recommend you to have a basic understanding of Dataiku DSS flows, scenarios, and automation — from the Dataiku Academy is a perfect introduction.
Why Operationalize ML Projects?
The goal of operationalization (or o16n) is to facilitate ML projects' move to production. However, achieving this goal is a real challenge, as there are many aspects to cover (we touch on some, like the relevance of a model or the business expectations, in the guidebook Data Science Operationalization — don't hesitate to read it as a complement to this article).
For this article, we will discuss the control, monitoring, and governance of machine learning model and AI application deployment. This can of course take many forms depending on your project, needs, and policies. Two basic concepts in o16n are automation and frequency:
- Automation aims at decreasing manual intervention as a factor of slowness and errors
- Frequency means that moving to production should happen as often as possible
The Continuous Integration (CI) and Continuous Deployment (CD) approaches — known together as CI/CD — are meant to streamline this move to production. As such, they allow the data team to focus on more valuable tasks than deployment issues. Regular and reliable deployments will also allow for easier debugging of flows and models by avoiding major changes.
The common word in both Continuous Integration (CI) and Continuous Deployment (CD) is “continuous:” you do not package, test, release, or move to production as an extraordinary event, but as often as possible. In order to achieve this goal, you need a reliable automation process and specific work in your Dataiku DSS project.
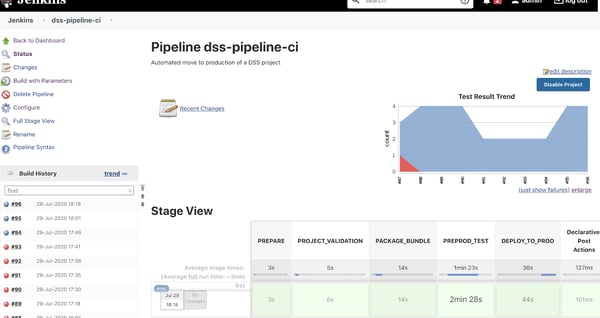
A fully automated CI/CD pipeline using Jenkins
Choosing the Components of Your CI/CD Platform
The Orchestrator
The backbone of your CI/CD project is called the orchestrator. It defines and runs the automation process, usually offloading the work to executors. There are many orchestration tools on the market like Jenkins, GitLabCI, Travis CI, or Azure Pipelines, to name a few.
Dataiku DSS has no specific relationship with any of them, and they will all work, as they all usually have the required features: building a pipeline with code steps leveraging Dataiku DSS APIs. The choice of orchestrator will therefore be yours according to your own needs and restrictions.
Artifact Repository
Artifact repositories are used in a CI/CD context in order to store released packages. This might be helpful in our case (or even mandatory in your organization) to store the models or flows that are going to be pushed into production.
Like orchestrators, there are many tools to do that on the market and, in the end, you will probably have to use the one your company is already using. You just need to confirm you can store a Dataiku DSS project bundle and that you can call it easily from your orchestrator (usually through APIs or plugins).
Dataiku DSS Nodes Architecture
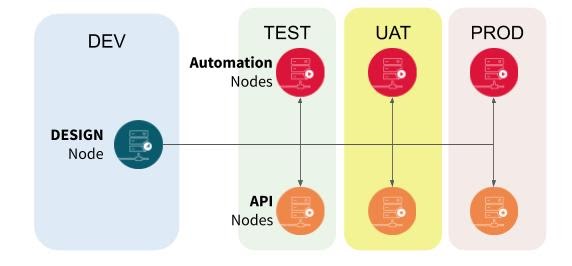
When dealing with operationalization, and especially CI/CD, multi-node architecture is a must have. If you are using only Design nodes, then your first step might be to look at what Automation and API nodes are to integrate them in your architecture. The minimal setup you need is one Design node as your development environment and one Automation as your production environment:
If your needs are more advanced, a more complete architecture is also possible, with work dispatched across multiple nodes and multiple environments, like this:
Source Repository
When operationalizing a Dataiku DSS project flow, one key element to decide is the pipeline source: where your process will begin. Standard CI/CD pipelines usually start with a source repository (like Git). From there, the source code can be exported, tested, compiled, tested, and packaged. This covers the CI part of the CI/CD flow. As for the CD part of the CI/CD flow, you are working from the package that has been generated by the CI part.
Since Dataiku DSS supports integrating with external Git repositories, you can take this approach.
.png?width=600&name=image%20(28).png)
Remote Git integration with Dataiku DSS
However, Dataiku DSS projects are not pure code — they are a mix of code, visual recipes, reference data, trained models, etc. Starting with the code stored in a Git repository will result in an incomplete project, missing the trained models, the reference data, or the insights.
The right way to preserve all Dataiku DSS project contents is to use the Dataiku DSS concept of bundles right from the start, along with the APIs to do both the CI and the CD workflow. Your pipeline will then start by building a bundle on the source design node and to use it as your CI/CD pipeline artifact.
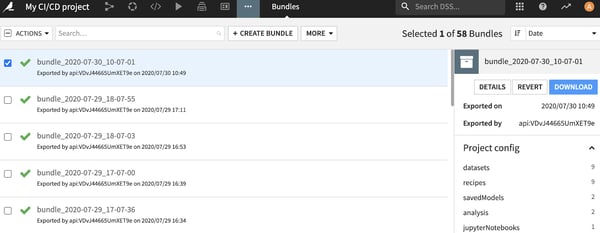
Bundles in Dataiku DSS contain everything needed to transfer a project to an Automation node.
Important Considerations for CI/CD & Dataiku DSS
There are numerous articles, blogs, and books on CI/CD — we will not repeat them. However, this section presents some important topics specific to the context of ML and Dataiku DSS.
Test, Test, and Test
Testing is probably the most important part of your pipeline, and it’s also the one that will require the most work. Tests need to be conceived and run at all stages: unit tests, integration tests, smoke tests, etc. However, there are specific ways to write tests that will make them more efficient and integrated in our case.
The first constraint is to write tests in a way that is compatible with your orchestrator so that you can use their result to act if the quality isn’t good enough. Usually, producing xUnit standard reports is the way to go — all test frameworks (and most orchestrators) support it.
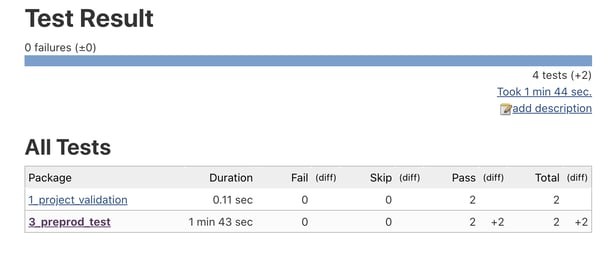 HTML human-readable report

Actionable xUnit XML report
With Dataiku DSS, the easiest approach is to write your tests in Python. Dataiku DSS has a powerful and easy Python client, and Python has several simple test frameworks that support xUnit reports (such as unittest, pytest, or nose)
.png?width=600&name=pasted%20image%200%20(1).png)
Using Dataiku DSS Python client to run unit tests
Additionally, when writing tests, you need to make sure to put the effort where it counts. That means not focusing solely on coding tests but also on business-oriented integration tests. For such a need, we advise you to look at Dataiku DSS scenarios:
- Scenarios are part of Dataiku DSS projects and can be created by the data team. This approach optimizes the test efficiency, as they are the people that know best what the project should do and what the most important parts are.
- Scenarios provide a rich environment with many steps such as building datasets, training models, or executing custom code. Most importantly, they natively support Dataiku DSS metrics and checks, making them perfect to run a sequence of tasks ending with a simple status of success/fail based on meaningful business indicators.
Additionally, since scenarios are part of the bundle, they are imported along the process and can be re-run at each stage very easily. You can imagine, for example, having a set of scenarios named TEST_XXX that you would execute one by one and return their result in a standard format.
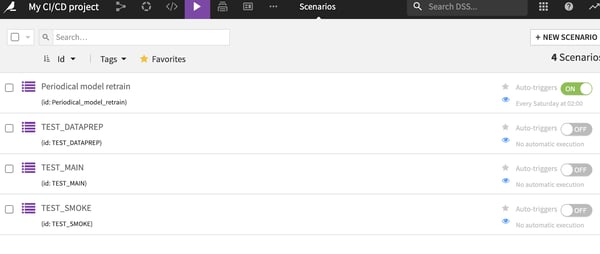 Using Dataiku DSS scenarios for testing a project
Build a CI/CD Pipeline, Not a CI Pipeline
A typical pitfall of CI/CD projects is that they tend to downplay the deployment part, instead focusing on the code, unit test, and packaging due to the longer experience on this part and the numerous tools and practices that exist. This is a mistake you should avoid at all costs: you need to focus equally on the code part and on the deployment part.
When dealing with deployment, there are many points that need attention — here are a few:
- Auditing: Any action that is performed automatically needs to be properly listed and accessible for analysis (after a failure, for example).
- Validation in production: You need to define a clear indicator of deployment success. Monitoring this indicator will help you spot failures and react.
- Integration/smoke tests: We have seen this before, but let’s re-emphasize the fact that tests should be run all along the process, and most importantly when doing the production deployment.
- Rolling back: What happens when a failure that occurs needs to be defined and implemented in the pipeline. The most basic aspect is to warn a human that (s)he should take over the process, but ensuring an automated rollback to the previous working configuration is the ultimate goal.
Additionally, here are some Dataiku DSS features that might prove handy in this context:
- Dataiku DSS has a built-in audit mechanism. However, it would record only the actions made at the Dataiku DSS level, so adding specific tools on your orchestrator is usually needed.
- Scenarios can be easily built to run on production nodes.
- As Dataiku DSS bundle history is kept on an Automation node, a simple API call (or a click) can revert to an older (working) version of your flow.
Apply CI/CD to the CI/CD
Your CI/CD project might start small with a few automated steps calling Dataiku DSS APIs and doing some manual tasks. However, if things are going well, it will grow fast and will end up with many different steps, several interactions with 3rd parties, customization by project or teams, and a lot of other features.
At that stage, your CI/CD project itself is becoming risky if you do not manage it well enough. Imagine you update the main code of the pipeline and introduce an error that breaks many builds. That is neither good for the productivity of your teams nor for your image. So don't forget to apply all the principles listed here to your pipeline project itself (central shared repository of code, releasing often, automated tests, easy rollback, etc.).
