


A recent investment report from Morgan Stanley showed that clients are increasingly requisiting investments that generate not only financial returns, but also returns that are positive for society. Traditionally, the way in which the financial industry has evaluated returns that are positive for society is across three axes based on their impact: Environmental, Social, and Governance (ESG). Whilst previously a niche area of investing, ESG is now front of mind for most investors, particularly younger ones, with the same Morgan Stanley report showing that over 95% of millennials have expressed the desire for their investments to be sustainably invested.
As with all new popular trends, the demand for what investors consider ESG-appropriate investment choices is outstriping the supply of products. The same Morgan Stanley report noted that two-thirds of respondents felt that the lack of ESG investment choices was the limiting factor to shifting towards more sustainable investments. This opens up the question to asset managers and investment providers: How can ESG values be incorporated into existing or new strategies?

This article shows how a successful subgroup of investing strategies in the form of smart beta indexes can be enhanced with alternative data sources to incorporate ESG and still outperform the market. The alternative data source used here was the 10-K Securities and Exchange Commission (SEC) filings that companies are required to make. Dataiku's all-in-one platform was used as the project environment due to its ability to easily combine individual project components — from cloud storage to application deployment — as well as its helpful version control integration.
What Are Smart Beta Indexes?
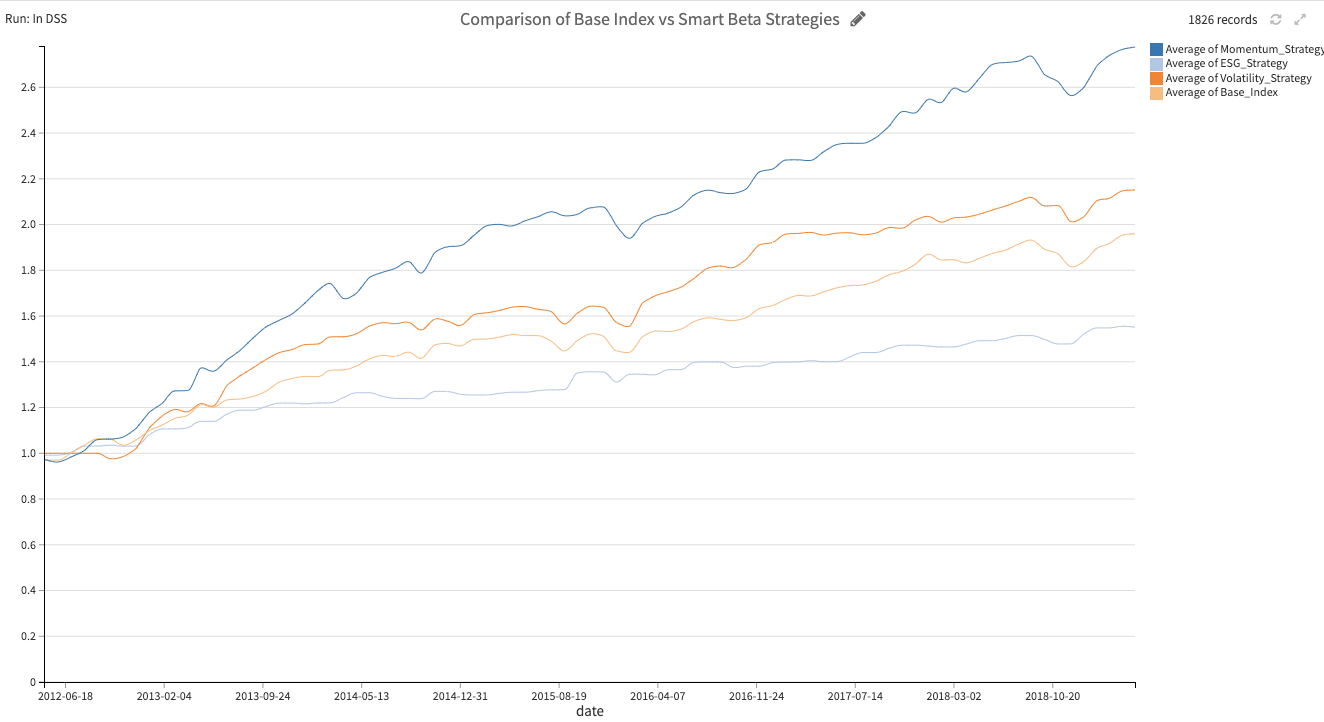
Figure 1: Showcasing traditional financial strategies and an ESG strategy built in Dataiku
Smart beta indexes are a subcategory of index investing which we will briefly step through to provide context. Index investing is considered a passive investment strategy that is seen as a good way to reduce investor risk (compared to single stocks) and gain exposure to an overall market. Indexes like the S&P 500 (a U.S. equity index of the top 500 companies) are calculated in the following way:
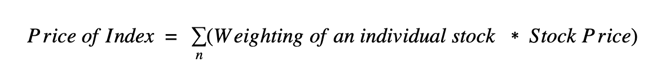
The weighting of each stock price is calculated using the market capitalization of the individual stocks as follows:
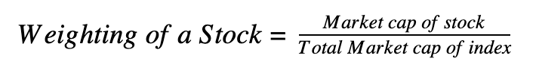
Using market capitalization as the weighting component of the index makes the assumption that the largest stocks are likely to produce the best returns. Traditionally, fund managers have disputed this assumption and tried to outperform these indexes through active proprietary strategies, changing the weighting methodology of the stocks in their portfolios. These strategies usually come at a large cost to the investor and the rules for the strategies’ success are usually hidden.
By comparison, smart beta indexes offer a rules-based method for incorporating the knowledge of fund managers into an index through the stock weightings, thus avoiding the large cost to investors. As a result, a 2019 FTSE Russell survey showed that 58% of institutional investors have smart beta indexes as part of their portfolio, a figure which is growing year on year. Of those surveyed, a further 77% also wanted to combine ESG with their existing smart beta portfolio, showcasing the demand for these products.
Strategies Developed
We developed two smart beta strategies in Dataiku: a momentum strategy and a low volatility strategy. We’ll explain the differences between the two below.
Strategy 1: Low Volatility
Low volatility is the theory that stocks which show little deviation from their mean are thought to be underpriced, potentially as they have not been part of a news hype cycle and are therefore undervalued. The expectation is that they will return to their true value over time. Here, a low volatility strategy was calculated over a one-year lookback period with monthly rebalancing and was shown to slightly outperform the S&P over a 10-year period.
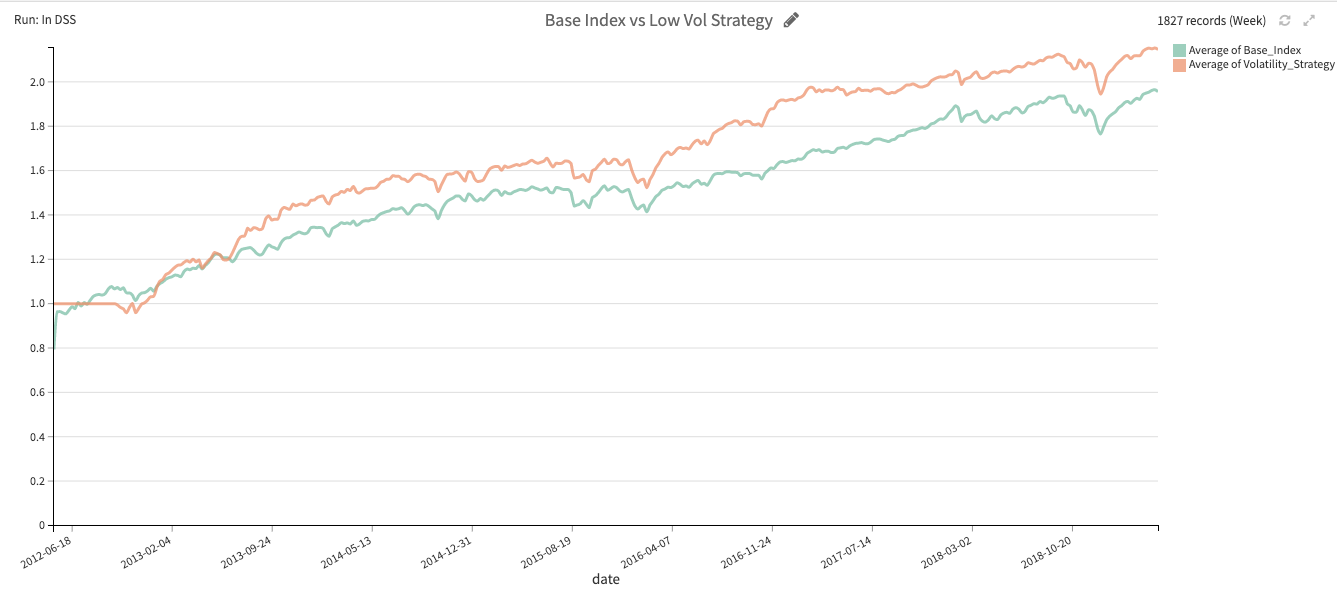
Figure 2: Showing the volatility strategy built in to Dataiku
Strategy 2: Momentum
Momentum strategies are well known in trading and work on the perspective that a stock which shows high returns in a previous time period is expected to see high returns in the next time period. The rationale behind this is generally that markets have either underreacted to good news or alternatively will keep overreacting to good news.
Below a momentum strategy is shown taking the top 50 stocks from the S&P 500, reweighting every month with a one-year calculation period. The strategy was back tested on 10 years worth of data.
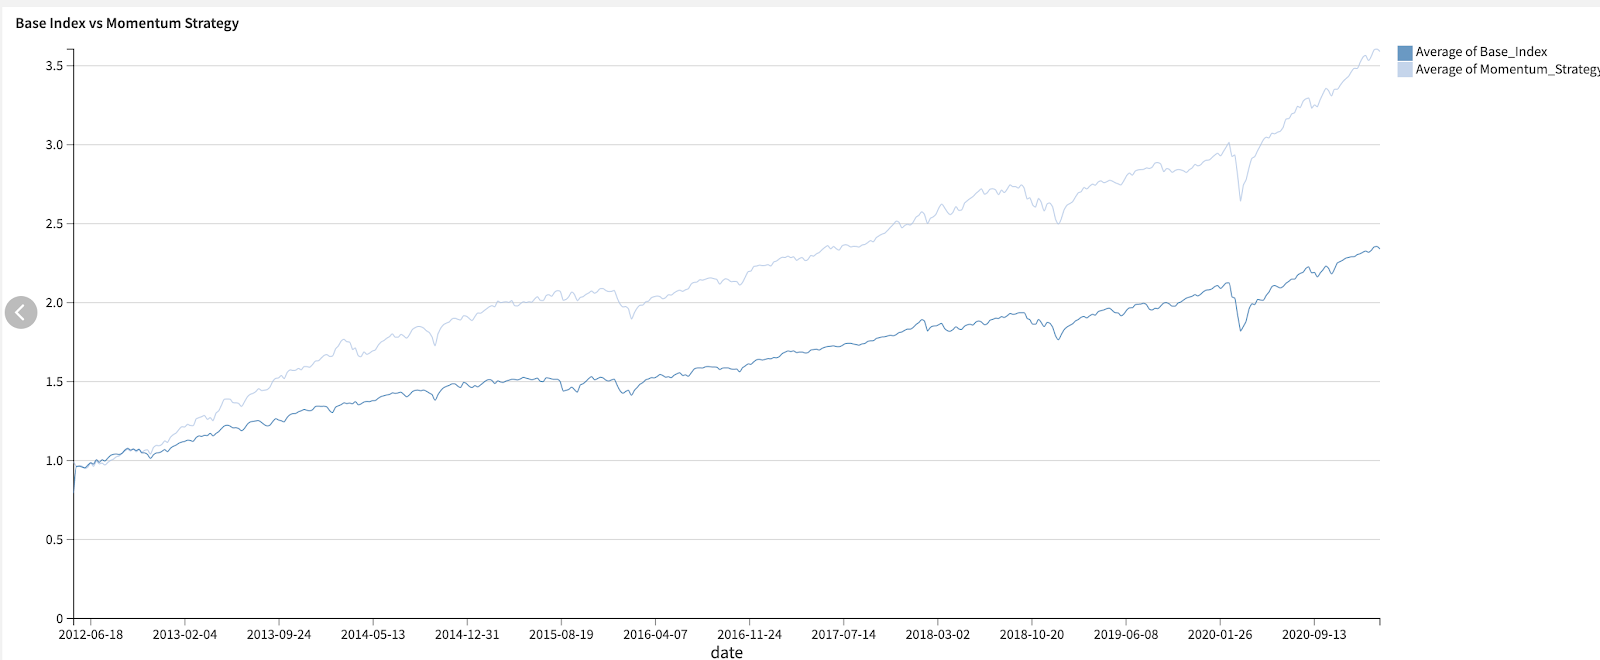
Figure 3: Showing the momentum strategy built in to Dataiku
It's clear that the momentum strategy shows exceptional performance, but there are a number of biases to call out in the data. Firstly, the selection universe was the 500 stocks that are in the S&P today. This carries an inherent survivorship bias when calculating back 10 years ago, so in reality this strategy would need to be run on all U.S. equity stocks. Secondly, there are no trading costs built into the portfolio. In reality, the cost of buying and hedging is often a large determinant of the success of a strategy.
How to Incorporate ESG Into Indexes
As we have now established two traditional smart beta investment signals, we move to looking to combine the ESG signal into the strategy. There are two key considerations when doing this:
The Data Source
Whilst third-party providers of ESG data feeds exist, they are not as established as pricing feeds and, as a result, a significant number of managers will calculate their ESG scores in-house. There are many external data sources that can be used and aggregated, such as news and social media feeds and regulatory filings. In this example, we show how a company's 10-K filings to the SEC can be used.
Recent HSBC research shows that companies are increasingly disclosing their ESG strategies in their regulatory 10-K filings to the SEC. The report suggests that ESG keyword usage is an approximation for the level of societal concern a company had. Using this knowledge, we executed Python scripts in Dataiku to pull and clean approximately 5,000 text filings (500 companies multiplied by 10 years of data) and built a PySpark pipeline for text cleaning and keyword analysis.
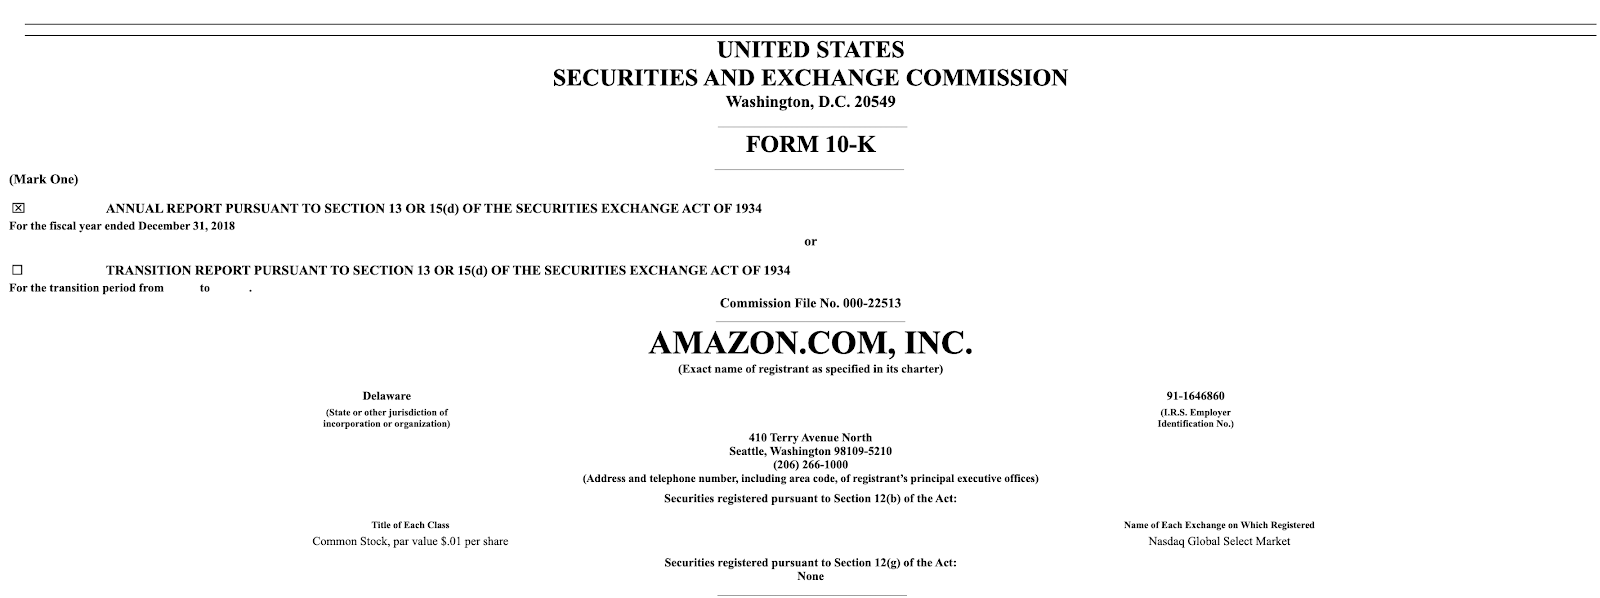
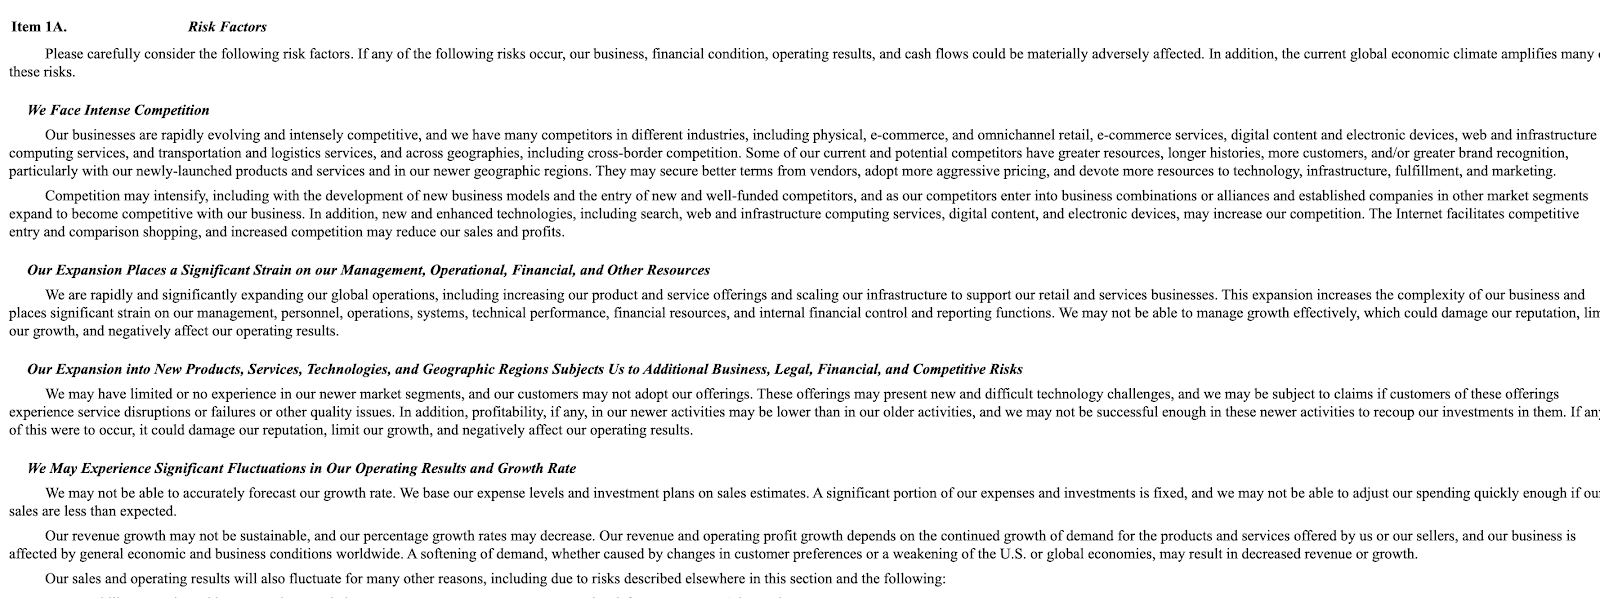
Figure 4: Showcasing extracts from Amazon 10-K filings. The full text doc is 42,000 words long.
Sequential or Weighted Signals?
Once we have established where we are creating our ESG signal from, the second consideration is how to incorporate it into the index. One approach could be to take some form of weighted average of your equity factor tilt (momentum or volatility) like below:

Another could be to apply the steps sequentially so that we filter our stocks to only those which satisfy a minimum ESG compliance and, from this pool, apply the equity factor tilt. This approach has the potential to be more popular with investors as it ensures that stocks that have a high momentum/low volatility signal but low ESG score cannot be included in the index. The flow of this second strategy was adopted here and looks like this:
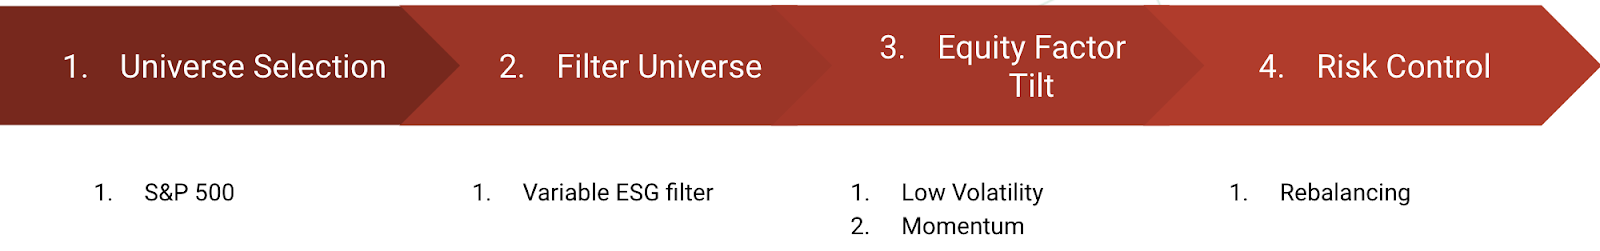
The final section of the index calculation “risk control” is the process of regularly rebalancing the index (recalculating the equity factor tilt) to ensure it does not decompose over time.
What Were the Results?
The indexes were built in Dataiku, as it enabled rapid deployment of the modeling environment to a Dataiku application interface, which surfaces the project variables through a front end to be utilized for backtesting.
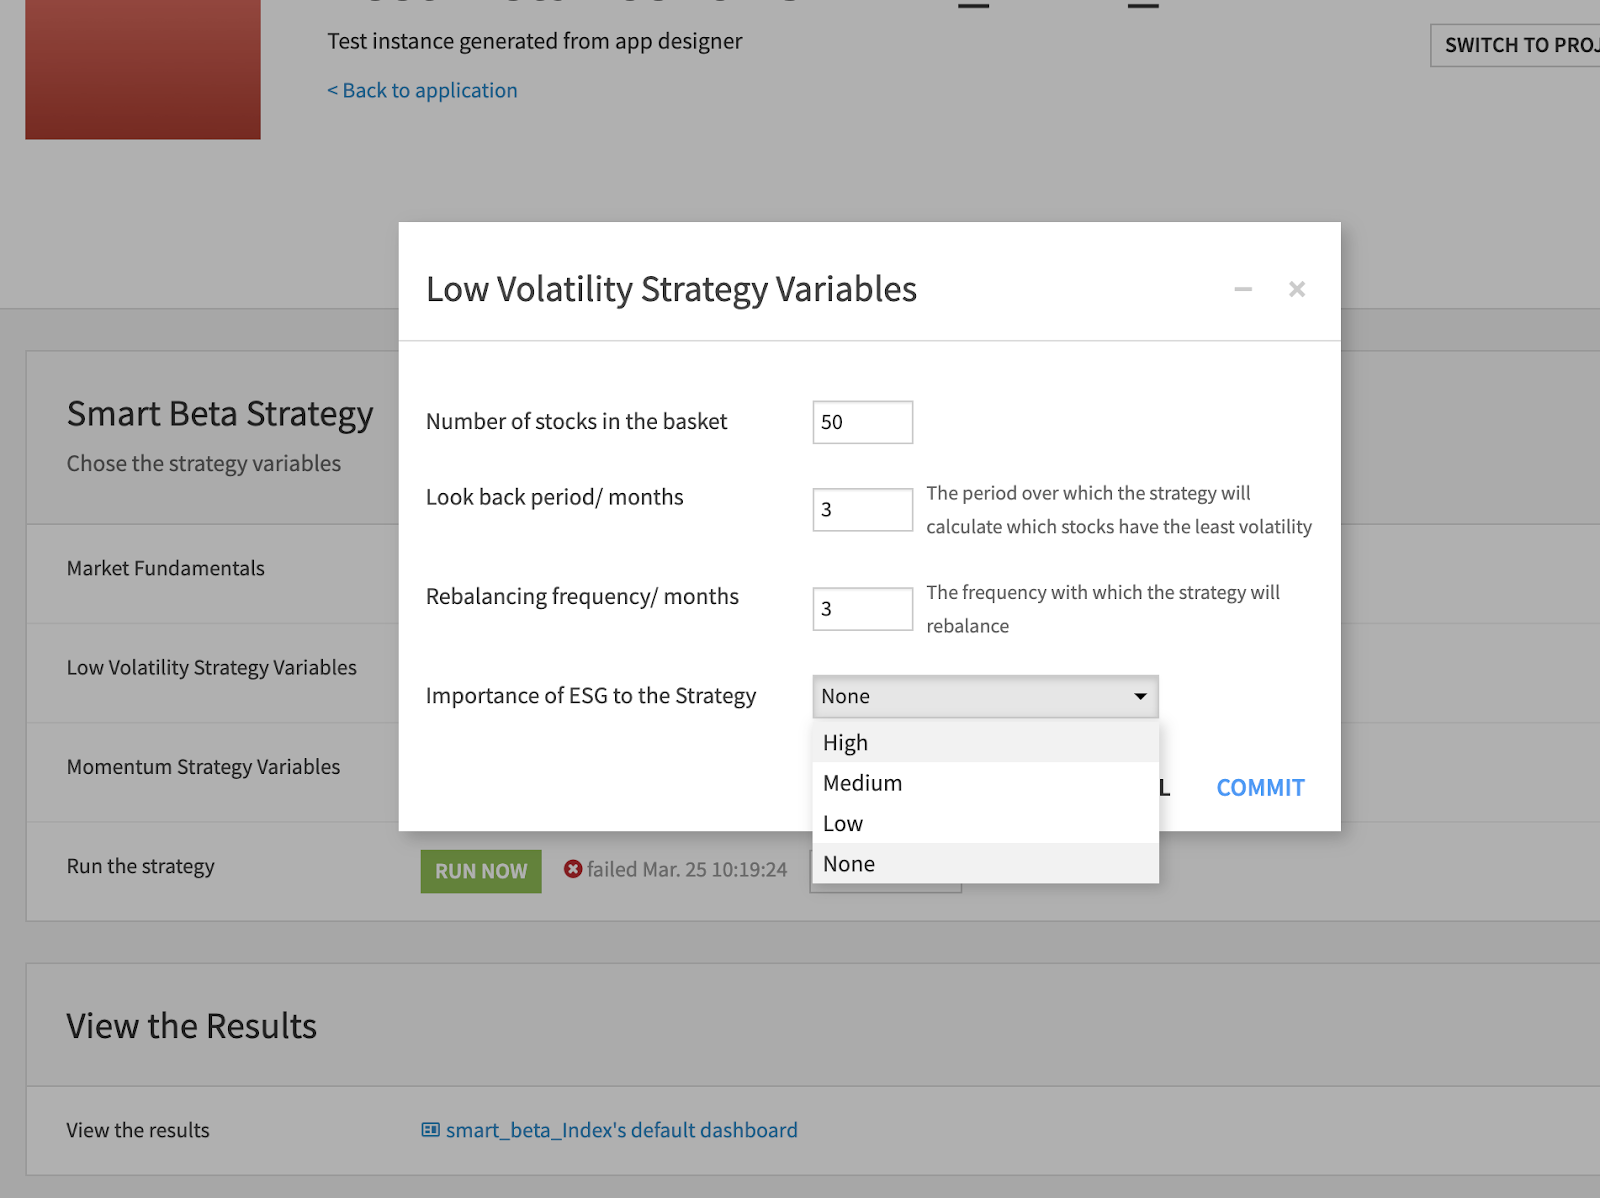
Figure 5: Application interface from Dataiku with important variables for the smart beta strategy.
ESG Influence on Strategy Results
The two figures below show the effect of ESG on each of the strategies. Generally, the importance of ESG to the strategy was inversely proportional to the returns made. However, the extent to which this occurred was not significant when compared with the base index (S&P 500). All low volatility strategies with an ESG tilt still outperformed the base index, giving investors an opportunity to outperform the market in a sustainable way. It is worth nothing that a low ESG contribution and low volatility tilt showed competitive performance with a standalone low volatility strategy (LowVol_None).
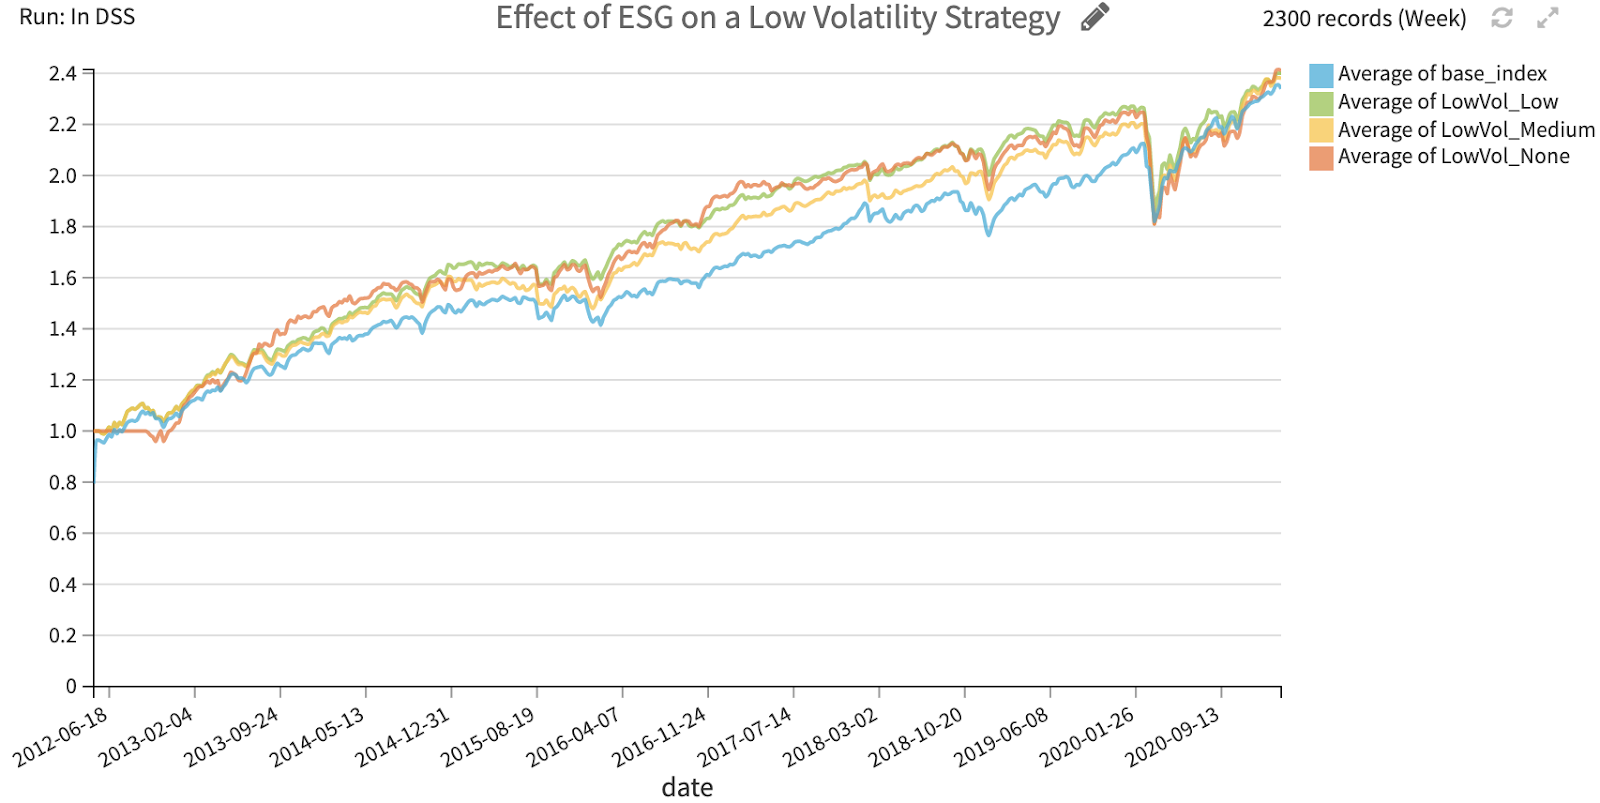
Figure 6: Visualization of the impact of ESG metric calculated from SEC filings on a low volatility smart beta strategy
It's worth noting that, on the momentum side, including ESG in the strategy with both a low and medium ESG contribution has a significantly higher negative impact.
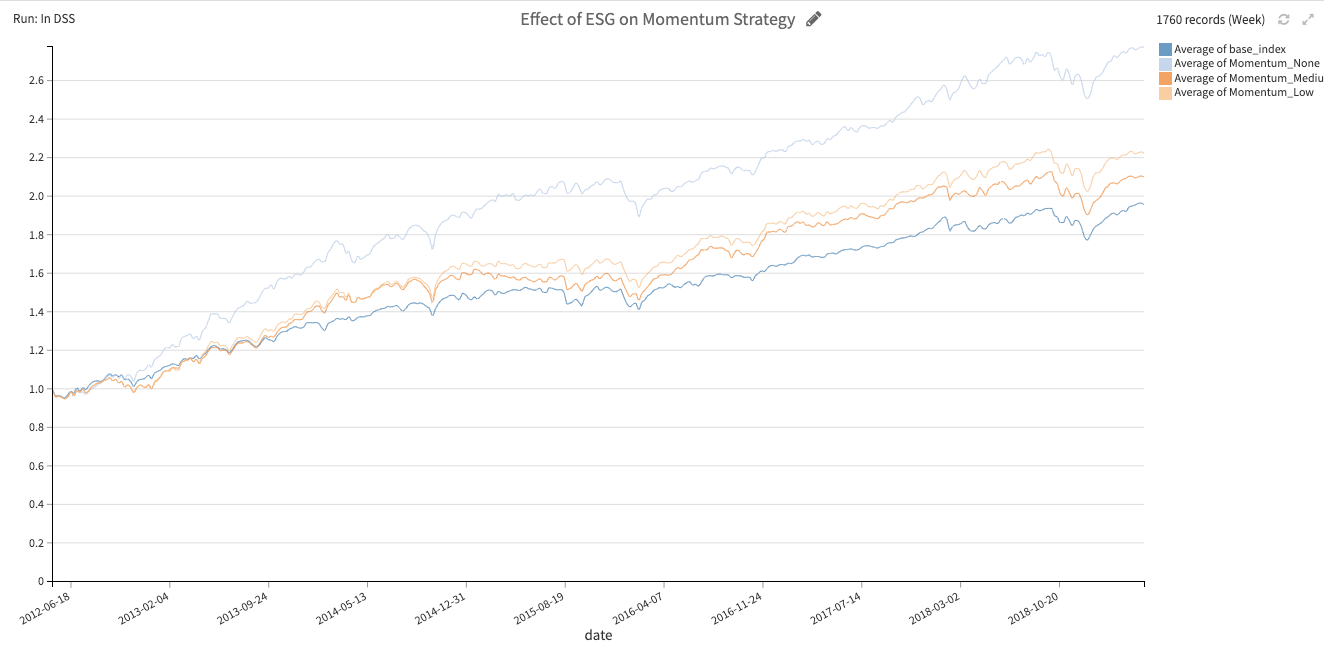
Figure 7: Visualization of the impact of ESG metric calculated from SEC filings on a low momentum smart beta strategy.
It is likely that our naive assumptions about calculating a company's ESG profile from 10-K filings using a keyword count is the reason for this reduced performance in the momentum and low volatility strategies. Validating this, we can see that ESG reporting is not consistent across industries, with utilities, base material, and energy sectors overreporting and technology and financial services underreporting.
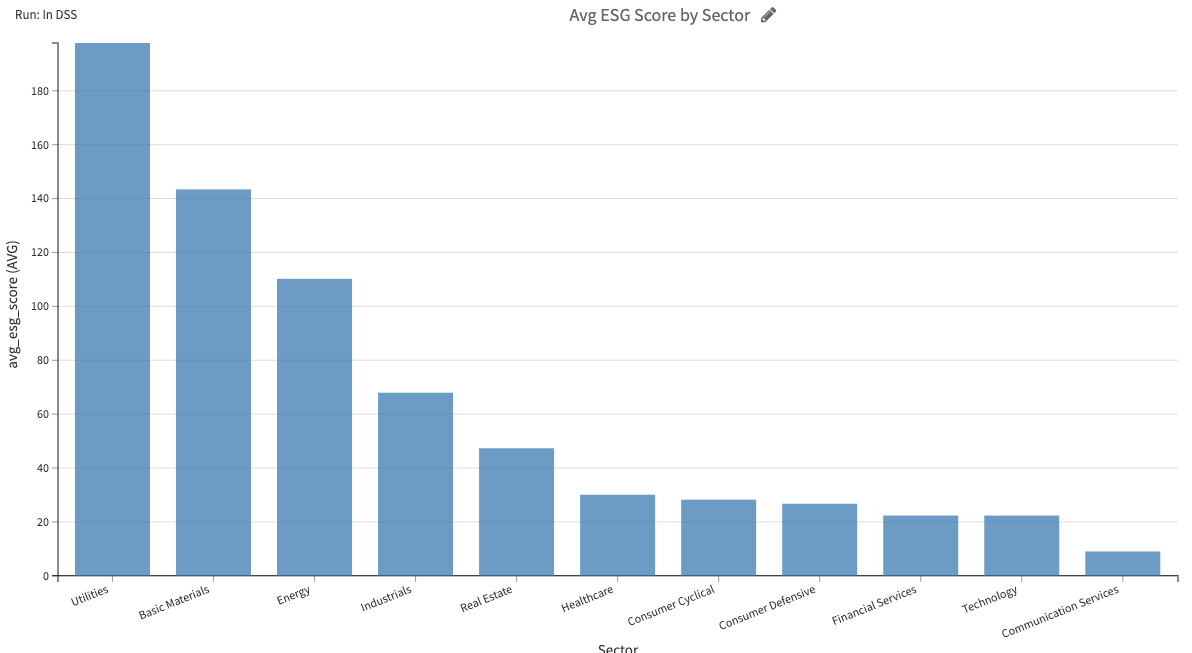
Figure 8: Visualization of the average ESG score by sector.
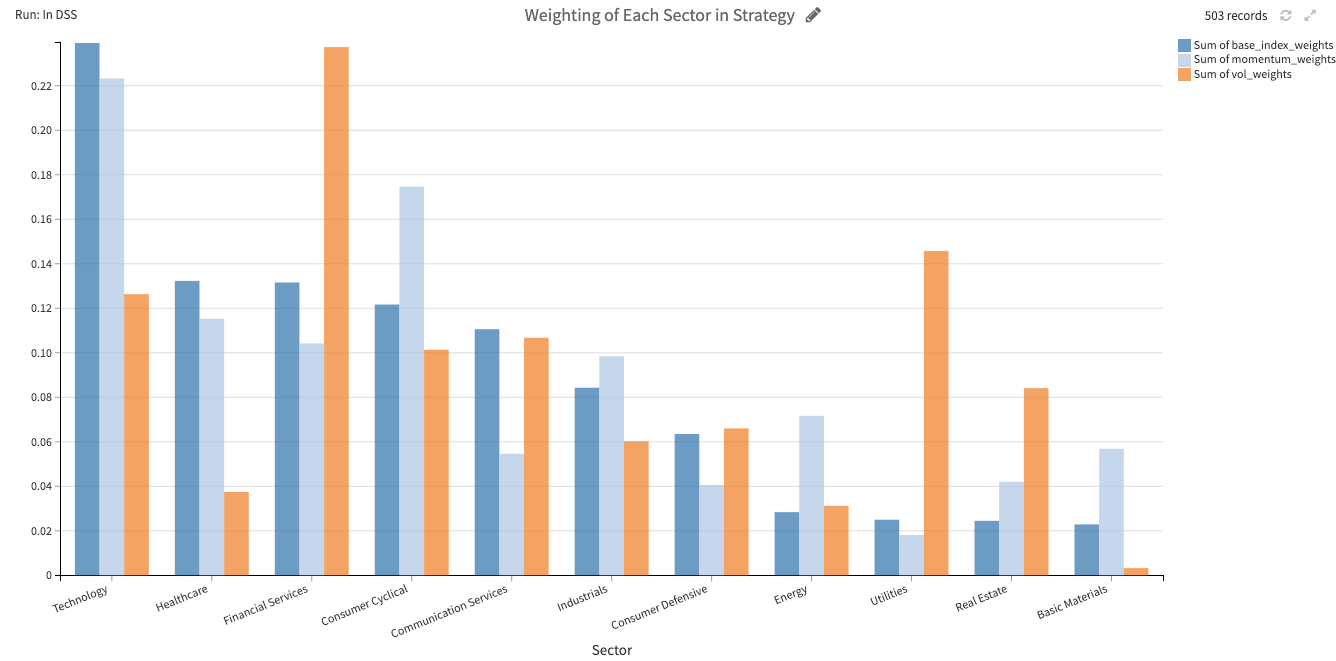
If we compare this with the average weights of industries for each strategy (excluding our ESG signal), we can see that technology, financial services, and consumer cyclical sectors are important components for both strategies. Therefore by including an ESG prefilter on our smart beta indexes we have reduced the likelihood that stocks from important sectors (technology, consumer cyclicals, financial services) will be included in the final index calculation. As a result, this is likely the reason for the lower performance of our ESG smart beta indexes versus their smart beta counterparts.
Next Steps
In this use case walk-through, we showed how to reweight a base index to create a smart beta index and how to use an alternative data source to generate an ESG signal. Our assumption that ESG can be extracted from 10-K filings was intentionally naive and could be improved by using news data as the alternative data sources or simply external data providers.