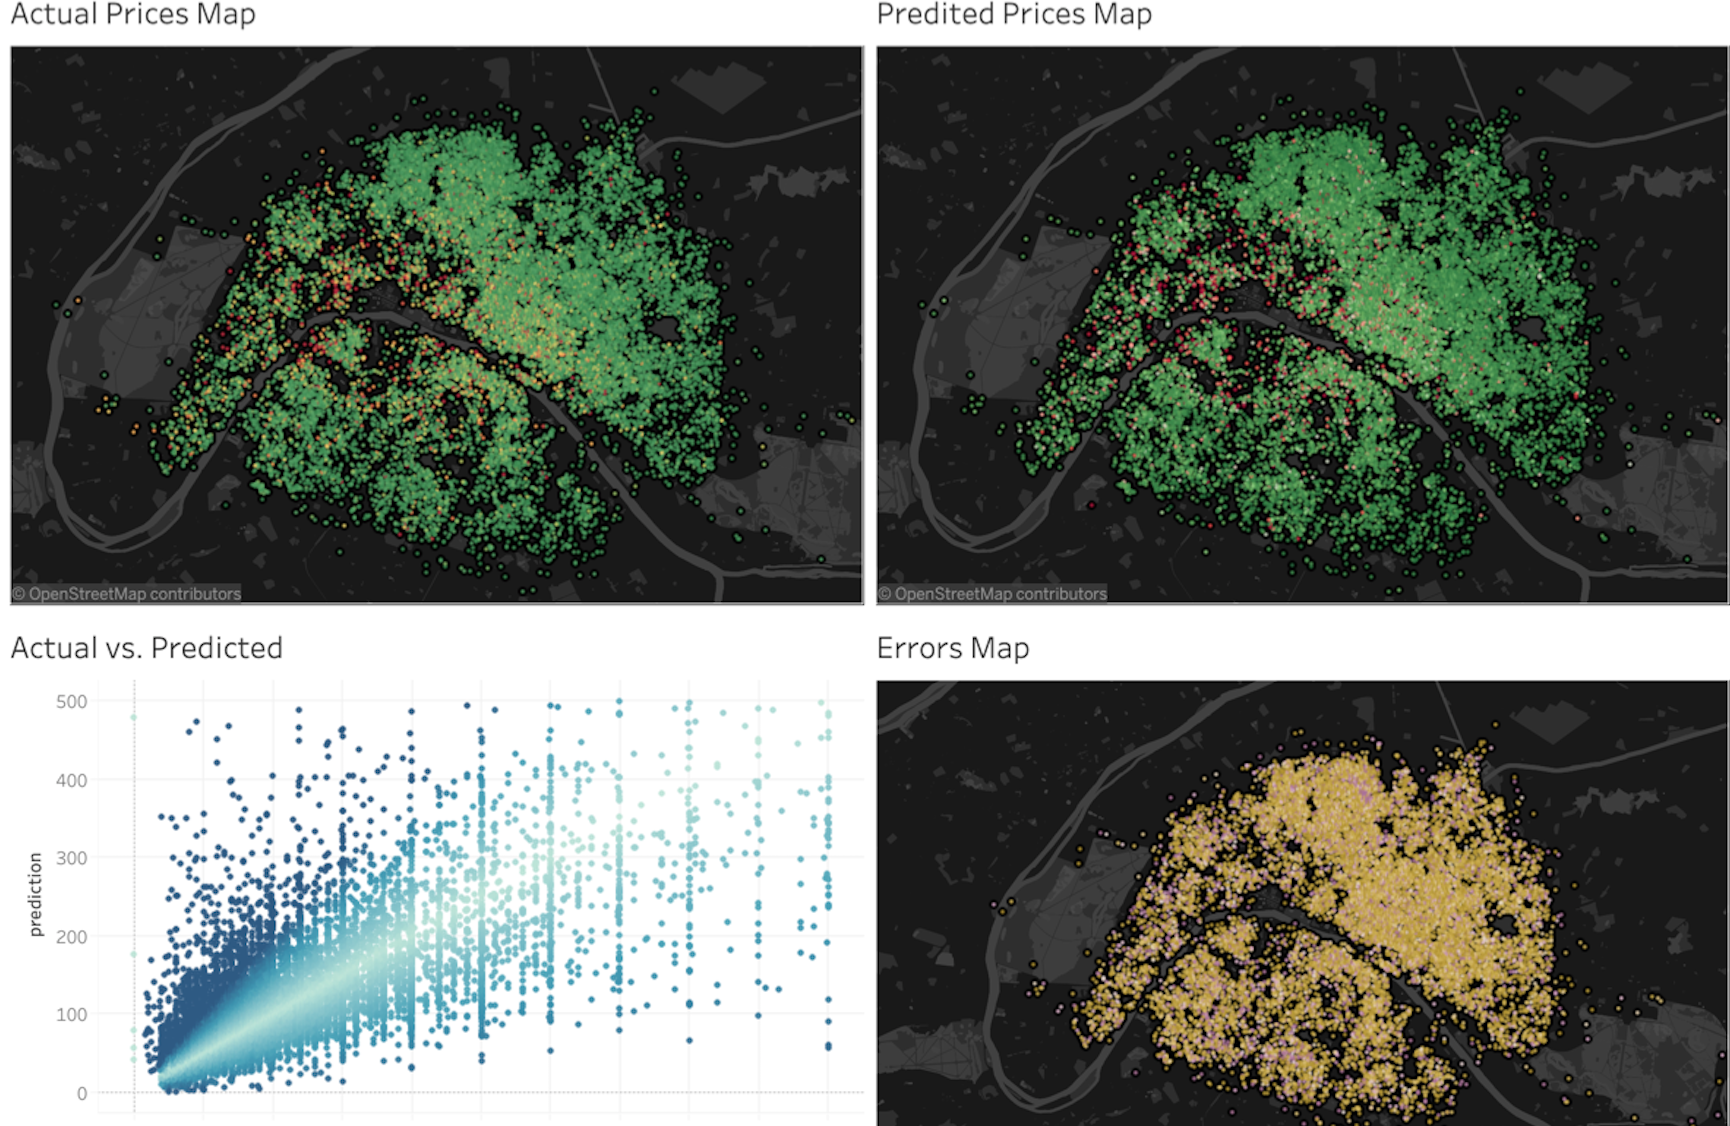
Data teams spend a majority of their time cleaning and wrangling data in order to extract valuable business insights. The numbers should speak for themselves, so dashboard data visualization is often an afterthought. However, the importance of dashboard data visualization comes back to communication, and it is an integral part of the business value in a model.

The Path From Data to Meaning
The actual work of data teams and the insights they generate remain obscure for many business-oriented teams and decision makers. In an ideal organization, data understanding would be distributed across teams, but silos are an unfortunate reality that perpetuate confusion and diminish the business impact and value of data.
When decision makers cannot fully comprehend data teams' conclusions, they are less likely to implement the changes that these insights would advise. When data teams present findings that differ from executives’ intuition, nine out of ten executives ask for more data instead of trusting the data processes.
Even when business leaders trust their data teams, it’s frustrating to accept advice without full understanding and visibility into the mechanisms that lead to those conclusions.
Transparency and good communication are key in any business decision, and dashboard data visualization allows decision makers to extract understanding from all the data, rather than receiving only a (necessary) simplification. Dashboard data visualization breaks models out of the black box of AI and enables teams to collaborate to drive the business value creation from the models.
Why Dashboards?
Data visualization is a key deliverable allowing business-oriented teams to understand data teams’ work and conclusions: communication remains essential. Dashboards take data visualization to the next level by creating context around a single image (and minimizing some of the potential for accidentally misleading visualizations).
Dashboards are great places to collect related data visualizations to drive a more complete understanding (so long as the graphs are updated frequently). Yet data visualization dashboards can quickly become cluttered and confusing, so it's important to evaluate precisely what visualizations will be useful in generating understanding.

The main difference between basic data visualization and dashboard data visualization revolves around how frequently data is updated. While data visualizations are just generated from data, a data visualization dashboard is regularly updated according to dataset modifications. Plus, dashboards enable easier comparisons between models driven by databases of vastly different sizes and types.
Dashboard data visualization has the added benefit of helping data team members collaborate and business-oriented users play with data and filter graphs to help expand their understanding.


