


This is the story of my literature thesis, which ran data analysis on short stories, and that I worked on to graduate with a B.A. in English this past May. It took me 10 laborious months of spreadsheet hell to complete the data acquisition and analysis. So after discovering Dataiku DSS, I wanted to see what it could do with my data and how it might have changed my process, and it was nothing short of magical.
Project Background (For Literature Nerds!)
The Caine Prize for African Writing is self-described as a “literary prize awarded to the African writer of a [published] short story written in English.” It’s widely accepted as Africa’s leading literary award, and it is one of the largest prizes in the world for a short story, with a £10,000 purse for the winner. Former Prize Director Lizzy Attree states that “[by] raising the profile of all the short-listed writers, past and present, the prize hopes to encourage reading and help to build a market for fiction in different African countries.” This neoimperialist notion of literacy catalyzation is a dated one that is intimately linked to critiques of the Prize.
The Caine Prize awards African short stories in English and faces a lot of critique for perpetuating a neoimperialist publishing landscape that prioritizes British and American readers.
Footnote: I won't go into all of the complexities here, but if you want to learn more I recommend reading the Caine Prize Equality statement and the research of Simon Gikandi, Emily Apter, Homi Bhabha, Graham Huggan, Dobrota Pucherová, and James English.
The Data
Questions of language are essential to an analysis of the Prize. The Prize only accepts submissions of stories written in or translated into English, yet describes itself as a pan-African (and diasporic) prize. English is obviously not the only language African writers wield, but for the sake of an easier judging process and a British audience, that was the way the Prize was established. Many accuse the Prize of being for British and American audiences, not African ones, which plays out in the usage of non-English words and phrases.
Instead of relying on thought pieces about the Prize, I decided to gather data from the shortlisted stories in order to try and discern any trends in the role of language in victorious stories.
For example, many stories incorporated dialogue “said in Afrikaans,” but in the text, it is written in English. Alternatively, a lot of French and Swahili words are incorporated into the narratives, only occasionally translated. I divided “language instances” into four categories that increased the distance between an exclusively English-speaking reader and the story:
Language mentioned: This occurred when a character was described as speaking in a non-English language, but the text was in English.
Accent mentioned/realized: This occurred when an accent is noted or manifested in the spelling of dialogue.
Translated text: This occurred when non-English words/phrases (as defined by the OED) are translated in the story.
Untranslated text: This occurred when non-English words are left untranslated.
In order to gather my data, I read each shortlisted and winning story from the start of the Prize in 2000, to 2017. I tagged each language instance and cross-referenced the dictionary to see if italicized words were non-English or if I just didn’t know them.

This is 100% how graceful I was while frantically reading 100 stories
The Analysis: Google Sheets
My analysis ended up comparing the “average density” of each language instance in shortlisted vs. winning stories. This was calculated by dividing the number of instances in a story by the number of pages. It was not pretty.
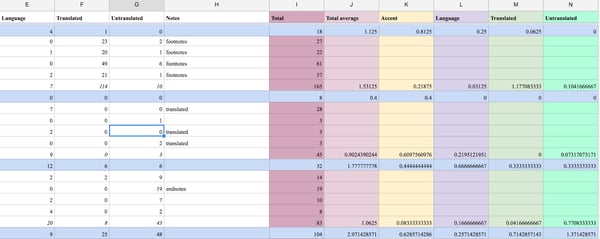
Data Sheet in Google
I tried consulting digital humanities librarians to no avail; they determined that my analysis was about as efficient as scholarship could get. I had to compare each variable independently, with no way of “weighting” the distance each type of instance caused.
My charts showed no statistical significance—thus implying that language did not impact a winning story, which means that the judges really are just trying to find the best story, not the most English one. However, my results mostly convinced me that I had failed in my initial experimental query, not that the Prize was absolved.
And even though I turned this project in and graduated, I wanted to know if I really had wasted a year of reading. So I turned to machine learning to see if I could get a more complete picture of language usage in Caine short stories.
Disclaimer: My data set is relatively small—only 100 points. The algorithmic models employed on Dataiku are strong enough to handle orders of magnitude more data. I would need to wait another decade or another century to gather enough data for these results to be truly relevant.
New Data Analysis with Dataiku
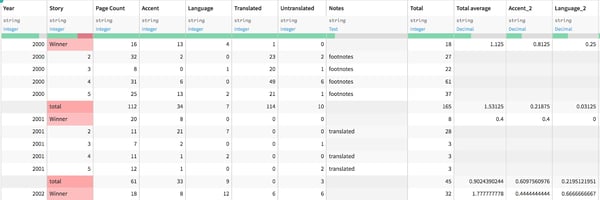
I started out by uploading my data sheet into Dataiku. There were a few extra columns, and I had some formatting to do to convert my color-coding into useful metrics:
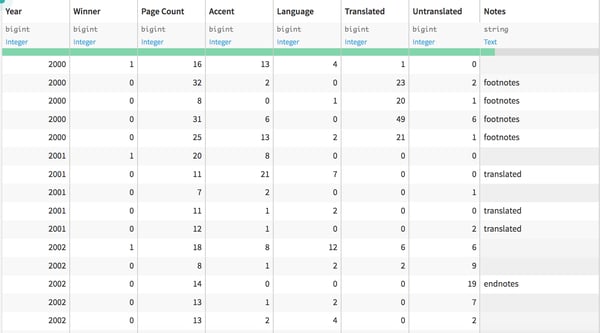
With some quick filtering, I was able to convert the “winning story” column into a boolean switch where “0” meant lost and “1” meant the story won:
I then went to create a new prediction model to evaluate the factors that contributed to a story winning. 5.0 automatically compares four different prediction models to find the one that fits best, but has the capability to generate many more models.
I wanted to test as many models as I could (a few aren’t relevant to my type of data). When I wrote this paper, each rudimentary statistical analysis took me a few days (I am not a statistician). The generation and evaluation of ten machine learning prediction models took less than a minute and determined that the gradient boosted tree was the most accurate model for my data:
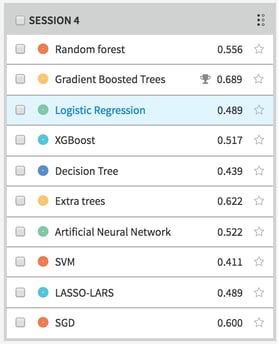
The program creates a hundred decision trees and tests their accuracy, generating a record of the most accurate model. My test set is relatively small, so it’s hard to get supremely accurate results, but Dataiku provides the “logic” of the model as best it can. I wouldn’t be able to comprehend the exact math, but by providing the weights, I can get a view on which variables contributed to the results most:
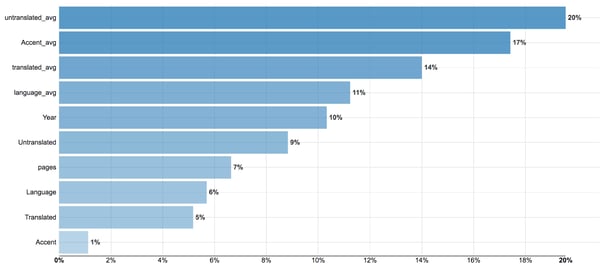
While this looks really compelling, statistical significance is not so easily understood. First off, I learned that multicollinearity, or variables that are mirrors of each other, corrupt the validity of the model. So including the Untranslated instance count and the Untranslated average is a bad practice.
So I regenerated the model with only the averages and the year. Another issue is that even though the model “fit” the best, the statistical significance of the variable contributions to a gradient boosted tree is hard to pin down, so I turned to the logistic regression model, which includes an instantaneous statistical significant evaluation:
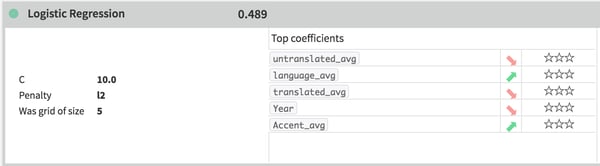
The stars on the right indicate statistical significance, and none of these variables demonstrate it.
While the regression did not fit as well as the gradient boosted tree, it indicated that none of the variables correlated strongly enough to the model for significance. This gives me a more robust indication that, at least with the data I gathered, there are no overarching non-English language qualities that distinguish winning stories from shortlisted ones. This is a vote in favor of the mechanisms of the Prize, but more research is required in order to truly evaluate the integrity and publishing impacts of the Prize. Maybe I’ll get a Ph.D.!
This new analysis took me one afternoon. That extra time could mean new studies, more data gathered, and a more complete data-driven picture. If you’re frustrated with working in Excel or spreadsheets, you can give Dataiku a try for free to see how it can speed you up and give some at-a-glance analysis that spreadsheets lack. Check out our guidebook on how to leave Excel behind.