


Dataiku 11 introduced major breakthroughs centered around empowering your expert technical communities and unleashing the potential of your subject matter experts and business professionals, all with a top level focus on AI oversight and governance.
With the new Dataiku 11.1 update, we continue our pace of rapid innovation. In addition to dozens of improvements to existing capabilities, many new features, some of which came directly from user feedback, aim to improve the overall experience in Dataiku for modelers, ML engineers, analysts, and more.
Enhancements for Data Scientists
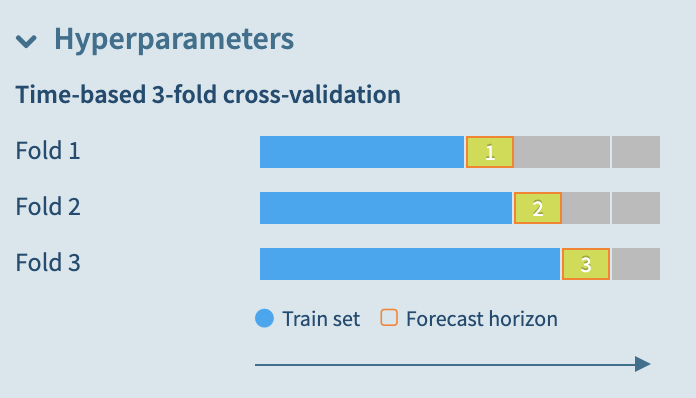
Data scientists will see new options added to time series modeling in the familiar visual ML framework. Users can now introduce time ordering into the cross validation strategy when running hyperparameter optimization. Consecutive, non-overlapping data folds ensure the model will train on past data to make predictions on forward-looking data, ensuring a more accurate model of production conditions. Additionally, data scientists can generate model comparisons for forecasting models.
When modeling classification tasks, data scientists can ensure the folds have the same consistent class proportions as in the whole population with the stratified sampling option, eliminating sample bias.
Explainable ML for Computer Vision and MLFlow Models
Dataiku’s visual ML interpretability functionalities support data scientists and ML engineers to better understand a model’s behavior, as well as make it explainable to stakeholders.
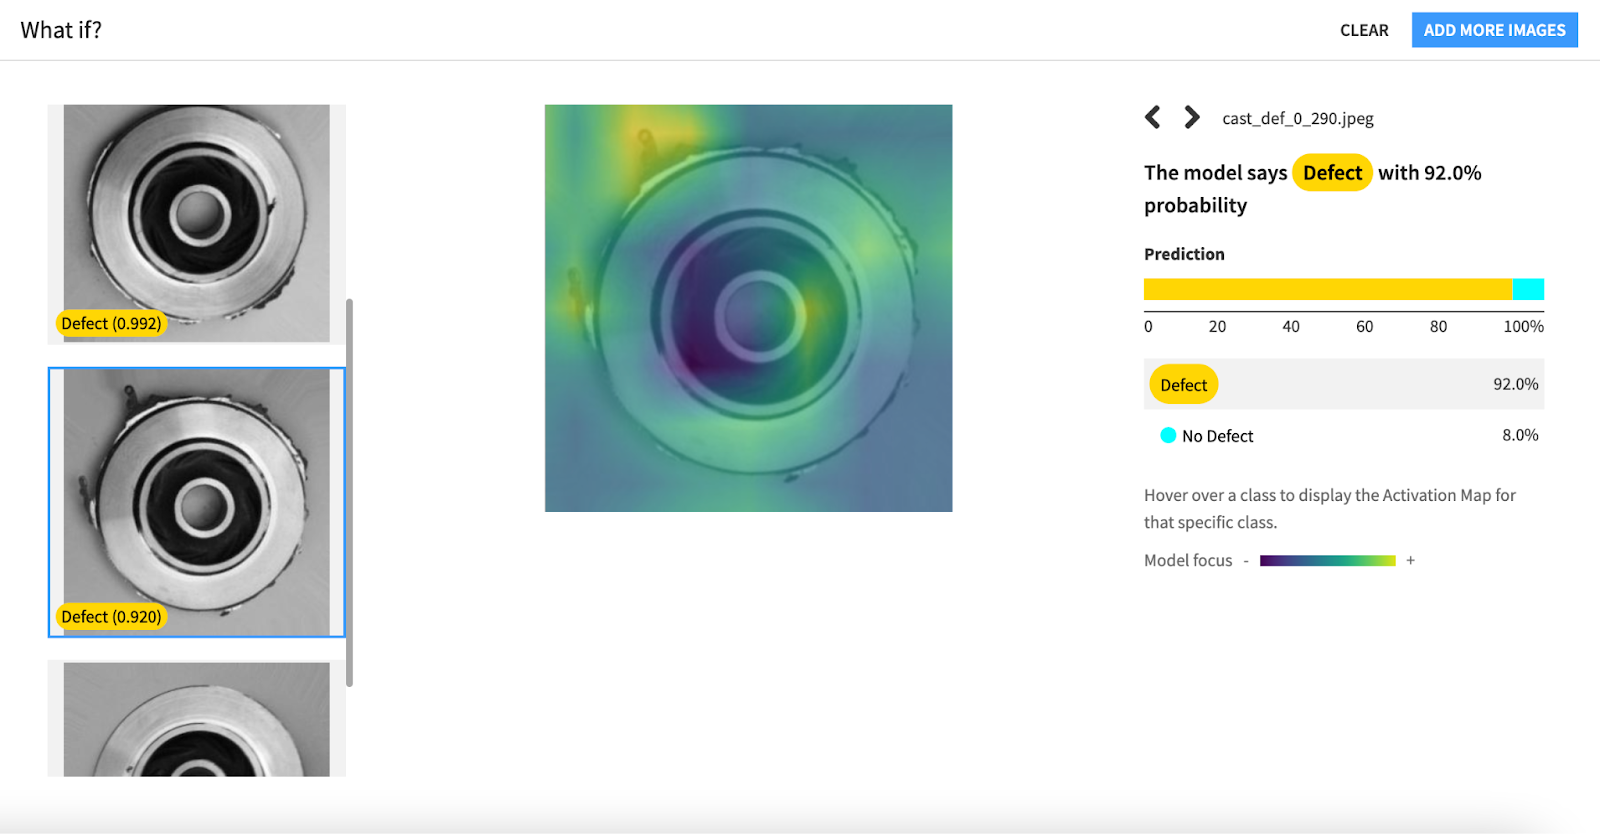
With 11.1, model explainability is now also available for image classification models. This translates to a visual heat map representation for each scored image, highlighting which areas were most influential towards the model’s prediction.
Another notable addition is making the full breadth of explainability features available for externally sourced models, brought into Dataiku through the MLFlow integration. Data scientists can now compute partial dependence to see how the model is influenced by values across each variable, subpopulation analysis to track any potential bias on subsets of data, and individual explanations to deep dive on extreme probabilities. This suite of computations takes interpretability to the next level for MLFlow models without any extra added effort from coders.
Model Export to MLFlow Format
Dataiku’s integration with MLflow has been a big focus especially for the developer community and expert data scientists who want to continue using familiar technologies, while still getting all the added benefits that are native to Dataiku. MLFlow models can be imported into Dataiku as saved models since Dataiku 10 and included in experiment tracking since Dataiku 11.
Continuing to strengthen this integration, models developed in Dataiku 11.1 can now be exported in the MLFlow format, for any ML engineers who want to include the open source framework into their architecture or deploy models outside of Dataiku.
Additional Chart Types for Visual Designers
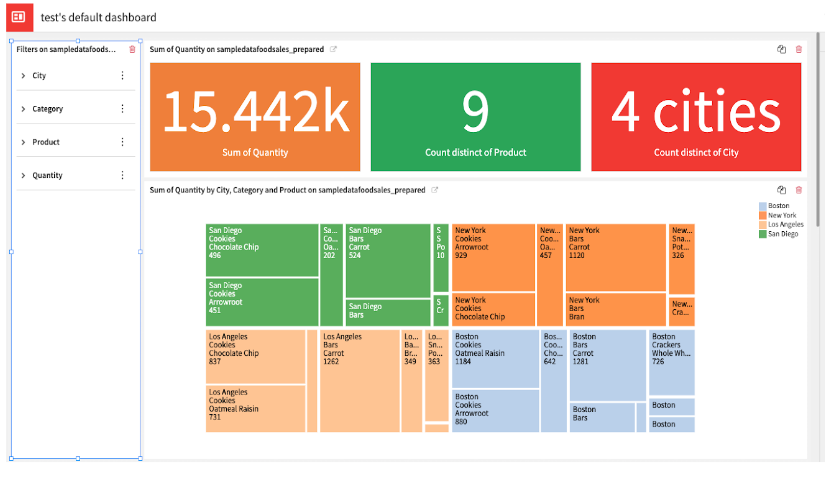
Dataiku 11.1 introduces new chart types to help users visualize and explore data. With KPI charts, users can now measure and track values associated with business objectives. Teams will appreciate the clear visual cues delivered by conditional formatting as they use these charts to quickly gauge KPI progress and status. Dataiku now also includes treemaps as an option for visualizing relationships and ratios between elements in categorical and hierarchical data.