


Evaluating different models is a critical step in both design and production, especially when you want to run Champion/Challenger or A/B testing strategies. The model evaluation and comparison capabilities of Dataiku make this crucial step even easier for practitioners.
In a recent Dataiku Product Days session, Dimitri Labouesse, Senior Solutions Engineer at Dataiku, walked us through these Dataiku features. Recapping the session and hitting the highlights, this blog will help you understand all the hype around these features.

Let’s get right to it. Why do these features matter? When you want to deploy advanced MLOps strategies such as Champion/Challenger or A/B testing, you need a way to directly compare new versus older models to see which delivers better results against the business objectives and the advantages and/or disadvantages of replacing a model currently in production.
With performance and model design in Dataiku, you can make informed decisions regarding the right time to launch new models as well as inspect the reasons behind degrading model performance. Dataiku’s capabilities are specifically designed to make this an overall effective and easy process.
Use Case 1: Comparing Models to Deploy the Best Possible One
Let’s say you are designing models and you would like to compare multiple trained models to understand how different modeling settings ultimately impact model performance. What are the next steps? After you train one or more models in Dataiku, with a simple click you can easily perform a “compare” action which will judge multiple models trained with different settings or hyperparameters.

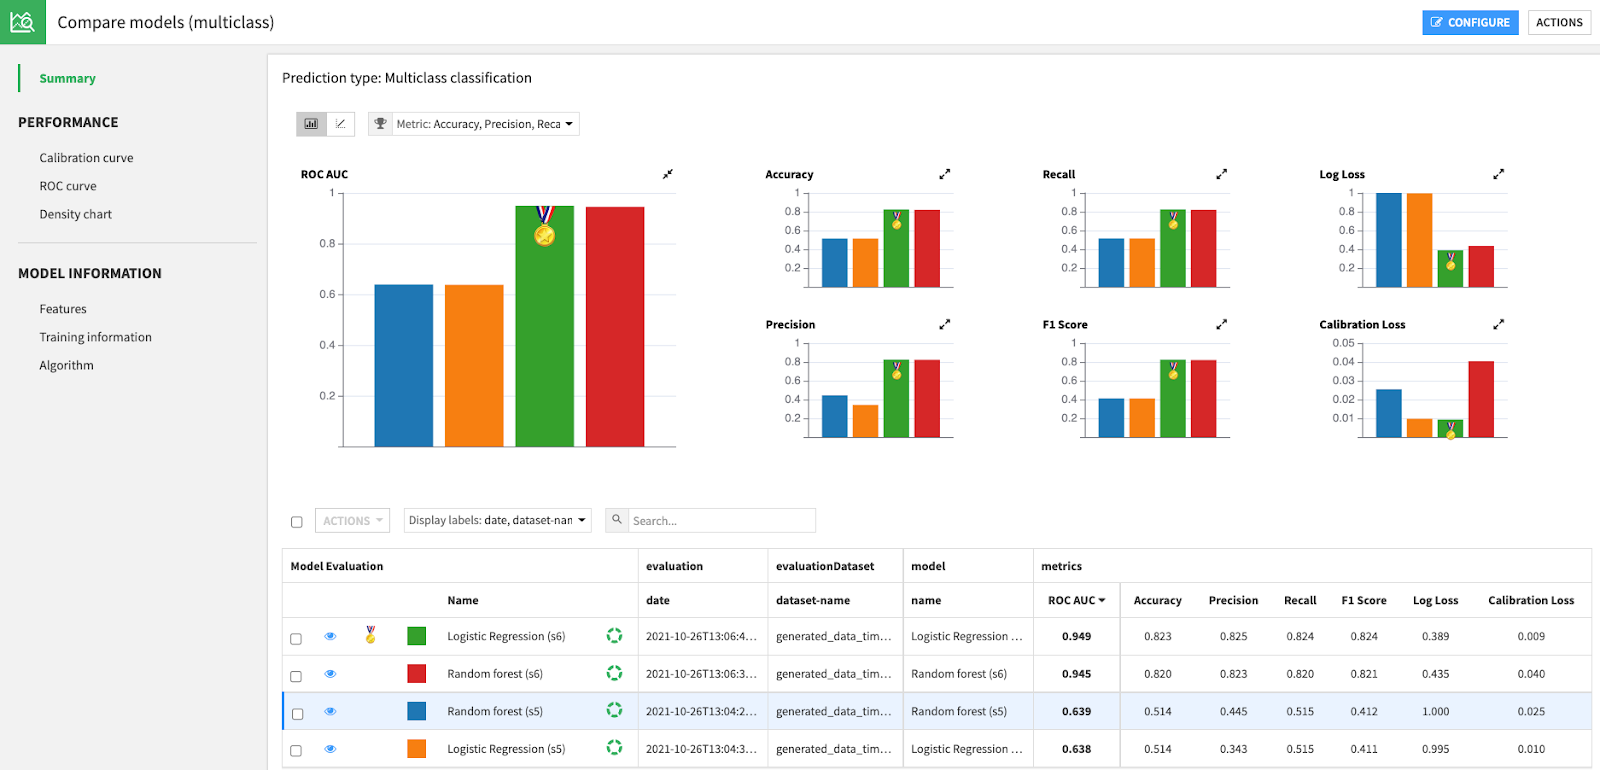
The comparison feature displays the performance of all of your models side by side, and you can check out performance visualizations including a decision chart, lift chart, calibration curve, ROC curve, and density chart for different ways to compare. Another intriguing point is that you are able to quickly investigate what details led to better performance for one model in comparison to others by clicking into model information and diving further into the features section.

Use Case 2: Automated Input Data Drift Detection
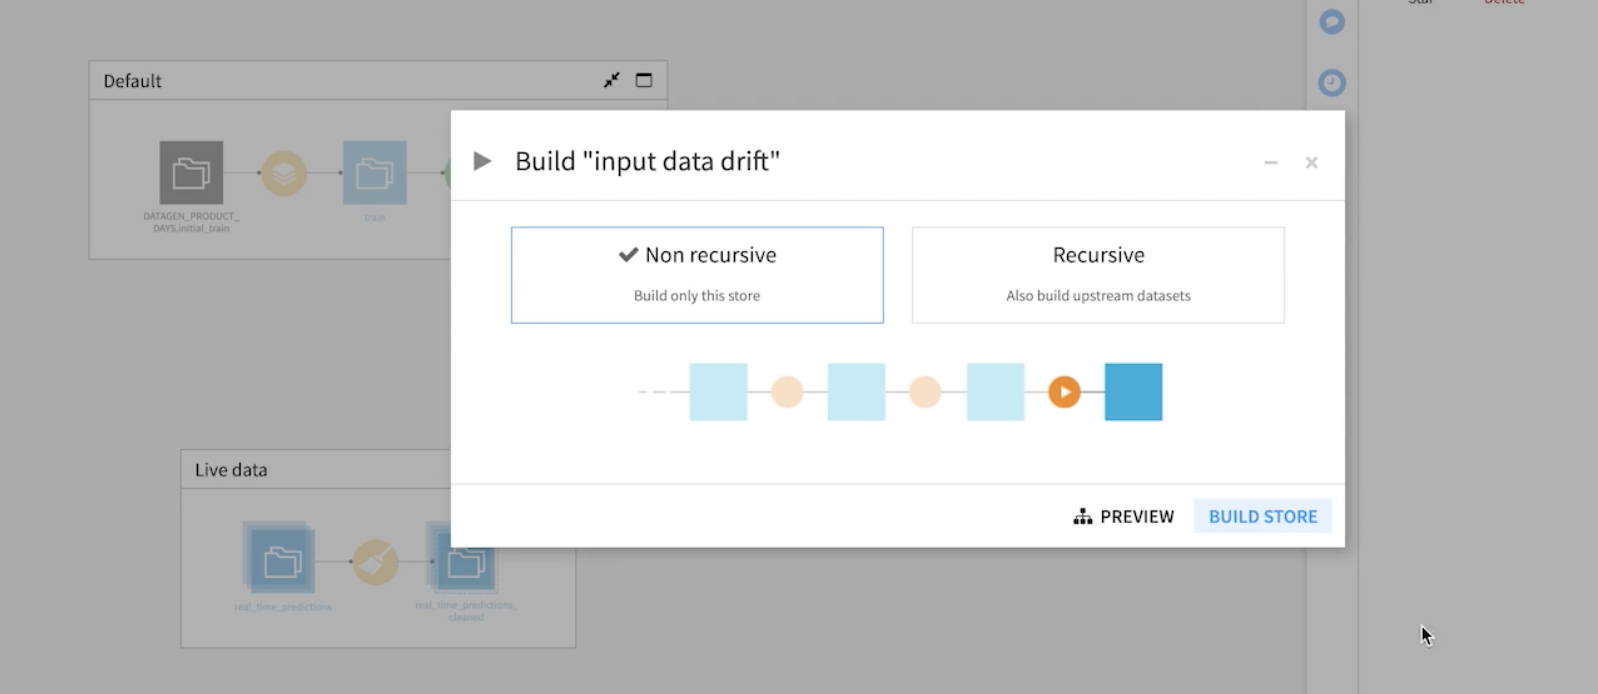
After a model has been deployed, using the API audit logs in Dataiku, you can receive, in real time, all of the data that your model is going to score in production. Here you can track the changes in data live as they are produced by your model. To check that the live data is the same as the data on which your model was trained, you can use a simple evaluation recipe in Dataiku which will allow you to identify and measure data drift.
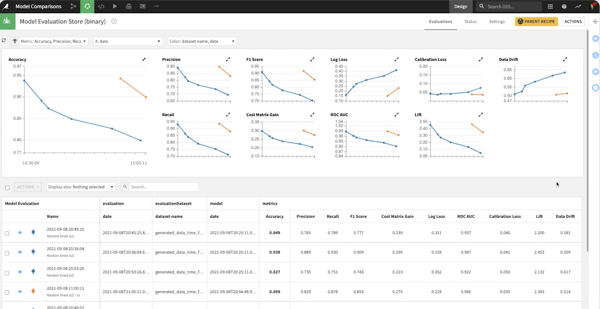
In the model evaluation store, you can find a score pertaining to the identified data drift of the models that you have evaluated. At any time, you can examine more closely the scope and impact of the potential differences that can be observed between your datasets.
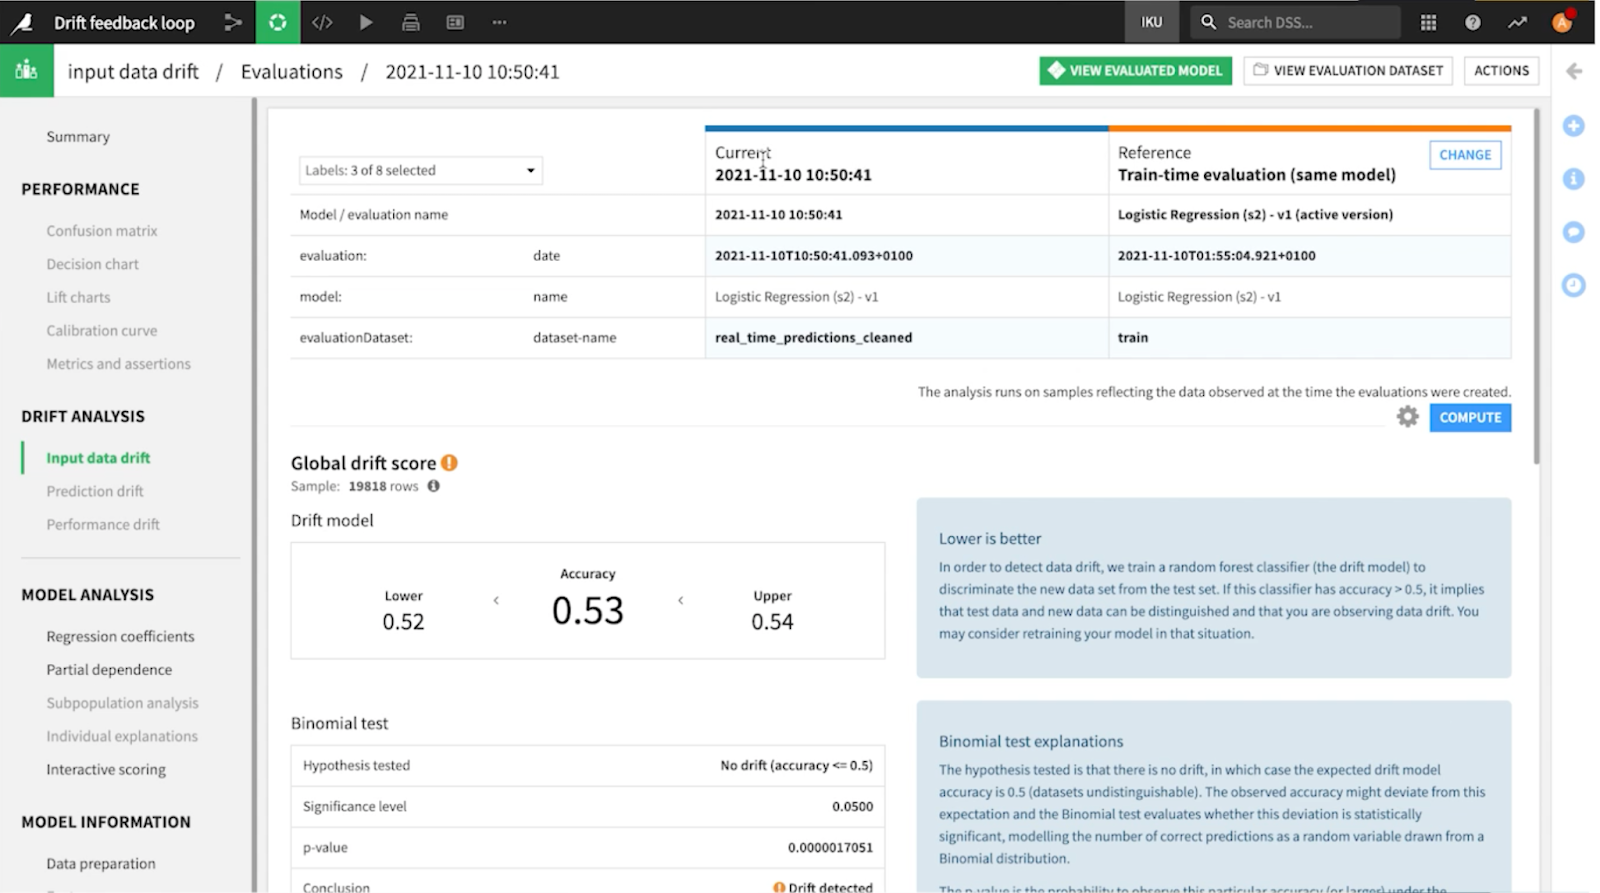
The global drift score gives you an idea of how well a secondary classifier model can distinguish between the current evaluation data and the data originally used to validate the model. In other words, is there a notable difference in the profile or composition of today’s data versus our baseline reference data? Plain English explanations help you understand how to interpret the results of these model drift tests.
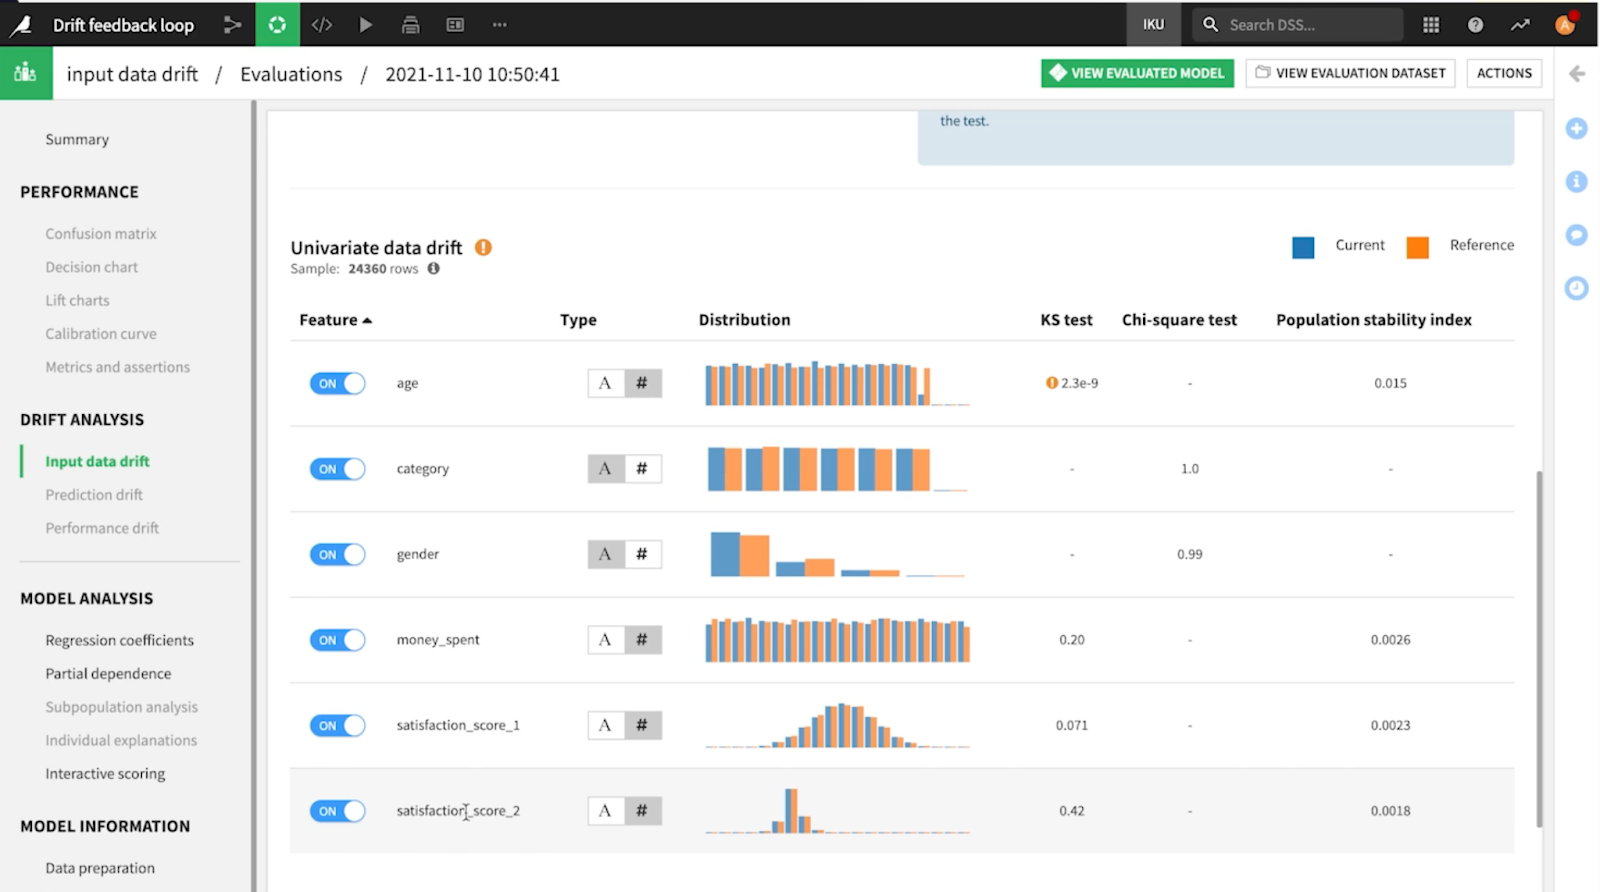
You can also investigate further to see which particular variables in your data may have drifted. And finally, you will find a scatter plot chart that displays the feature importance for the original model versus the feature importance for the drift model to help assess whether features that have drifted are in fact important to the prediction and therefore likely to cause different model behavior.

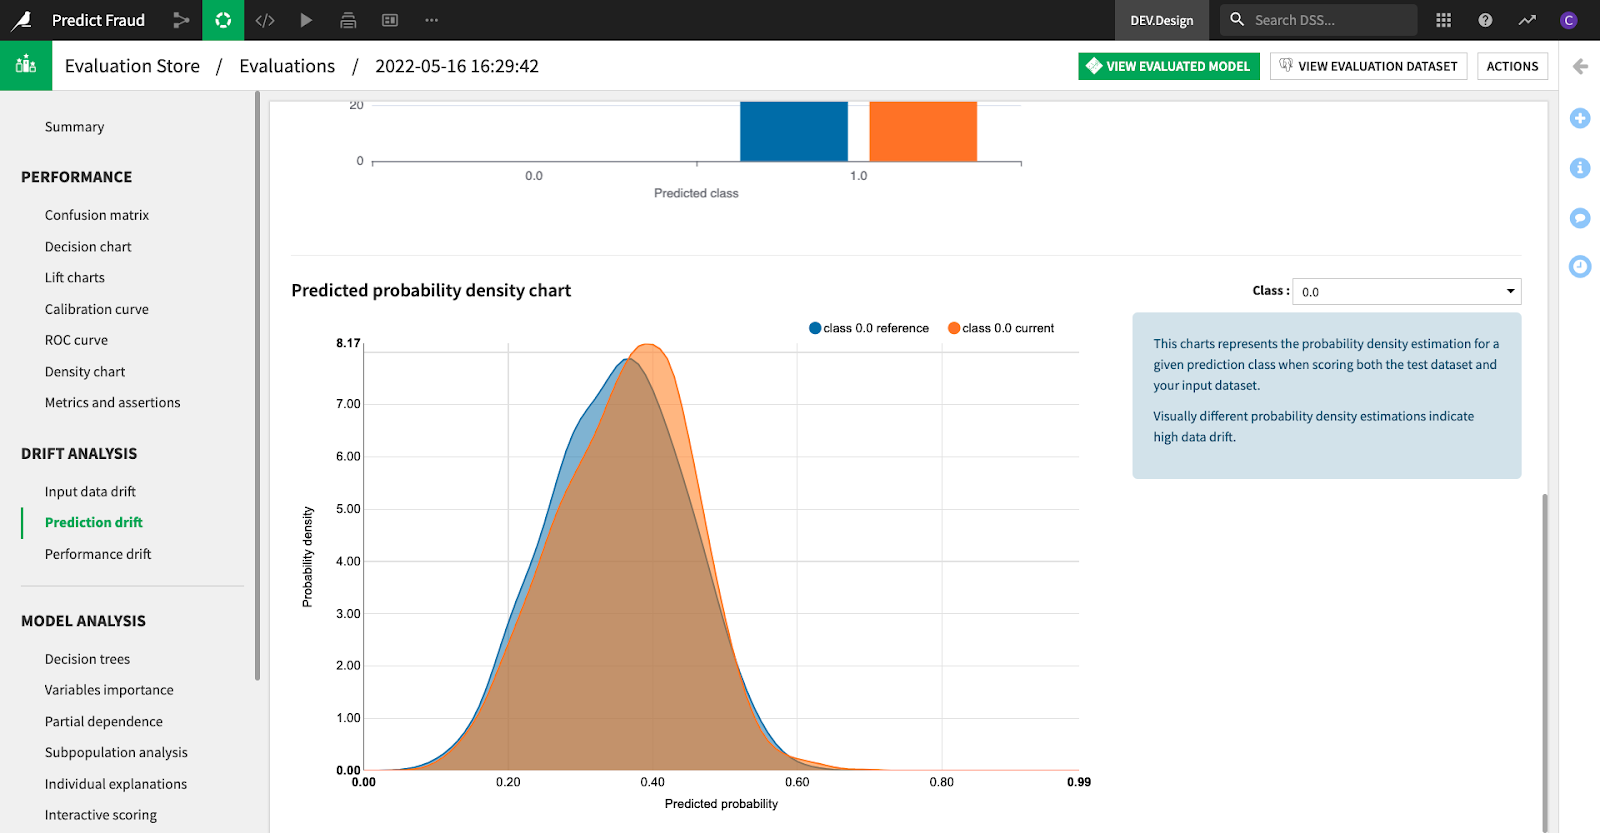
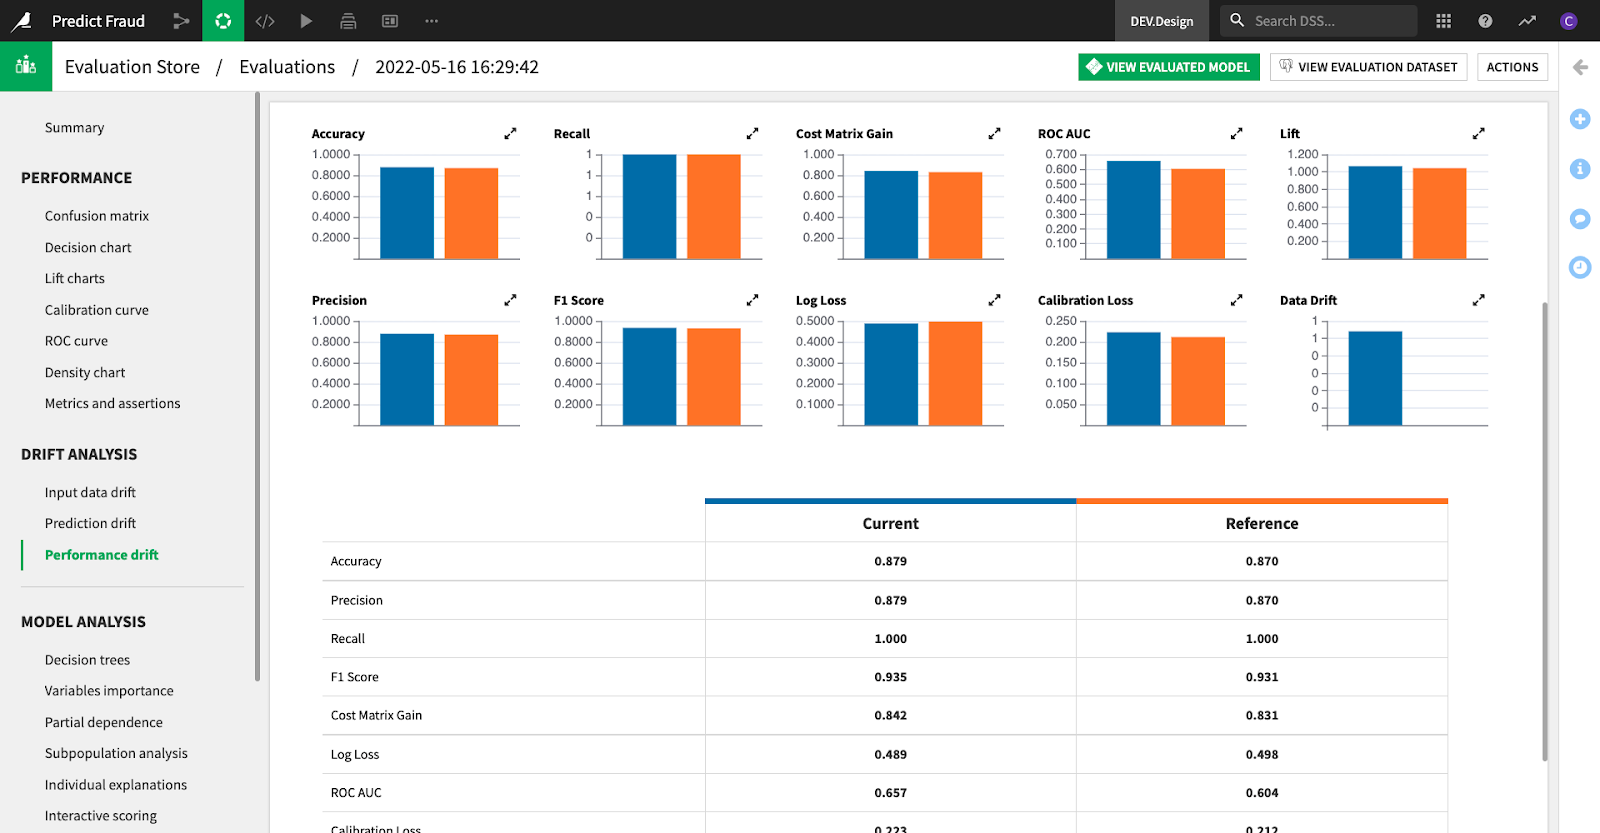
In addition to exploring and evaluating input data drift, Dataiku also has separate tools to help you examine prediction drift and performance drift. For example, a fugacity table and density chart enable you to inspect the values and distribution of the expected vs observed predictions.

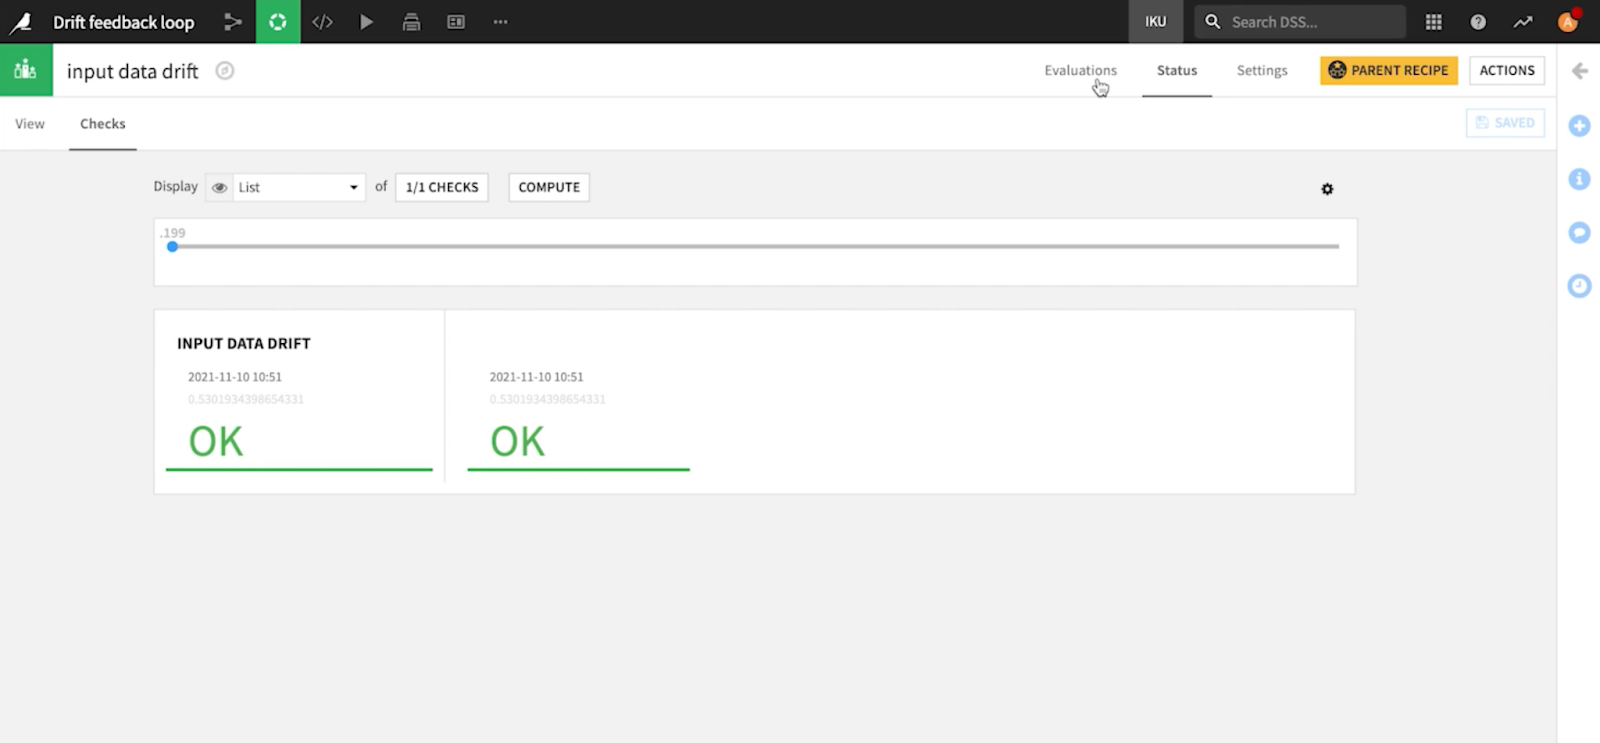
Interactively evaluating models is useful, but tracking the performance of a production model requires some level of automation. In Dataiku, you can monitor the model performance on live data and automate said monitoring of your model with the presence of controls. This will enable you to track and verify the stability of model performance over time. This can help you make key decisions along the way in regard to the timing of new launches as well as indicate when your model needs attention.
If you are eager to learn more and would like to follow along with a more in-depth walkthrough of these newer features in Dataiku, be sure to check out the full Product Days session.