


For most people, spring means blooming flowers, longer days, warmer temps, barbecues, and picnic season opening. For Dataiku engineers, spring also means Hackaiku week, our annual internal hackathon! We held the third edition this year at the very beginning of May. Read through to understand how the event works and discover this year’s top three Hackaiku projects, as described by the engineers who worked on them.
The Golden Rule: Do Whatever You Want
At Dataiku, the engineering culture is open (i.e., encourages debate, any engineer can contribute to any part of the codebase) and based on autonomous work (i.e., developers can suggest ideas and explore projects they cherish all year long). However, we know that it can sometimes be complicated to take a step back from the day-to-day activities and find the right time to sync with others in order to make ideas come to fruition. We created the Hackaiku week to make sure we secure time at least once a year to think, try new things, learn, and innovate together.
The week is structured this way:
Engineers are invited to create teams (of two people minimum) and communicate on the project they are going to work on Day 1. These projects can of course be related to our product, but they can also be linked to a productivity tool or any new experiment engineers would like to try out. The “do whatever you want” rule has no exceptions, so it also applies to engineers who prefer to keep working on their usual work — the Hackaiku week is not mandatory. On Friday, participants and non-participants are equally invited to watch the demos and send kudos to the projects they prefer.
What Happens Next?
Well, again, there’s no strict rule! The Hackaiku week has proven to be a good incubator for new features and the three projects summarized below will be further explored to see if and where they could fit in our product roadmap. But let’s be clear, the purpose of the week really is to have fun and experiment new things together. Not all projects end up being industrialized, and that’s completely fine because we ultimately learn from each other and each unique project.
An Overview of This Year's Top 3 Hackaiku Projects
1. Semi-Automated Data Exploration
Team: Alexandre Dumont, Ludovic Pénet, Frederic Terrazzoni
Starting point: In Dataiku, interactive statistics assist the user in explaining and discovering interesting properties hidden in a dataset. The current tools are quite powerful yet they all assume that the user has an idea — even a very vague idea — about what he/she wants to plot, what kind of chart/tool should be used for this task, or even how the columns may be correlated to one another.
Hackaiku team goal: Push the automation of the Exploratory Data Analysis (EDA) one step further by attempting to guide the user even more during his or her data journey. Expected use case: Help Dataiku users spot broader patterns in the data without doing a time consuming deep dive.
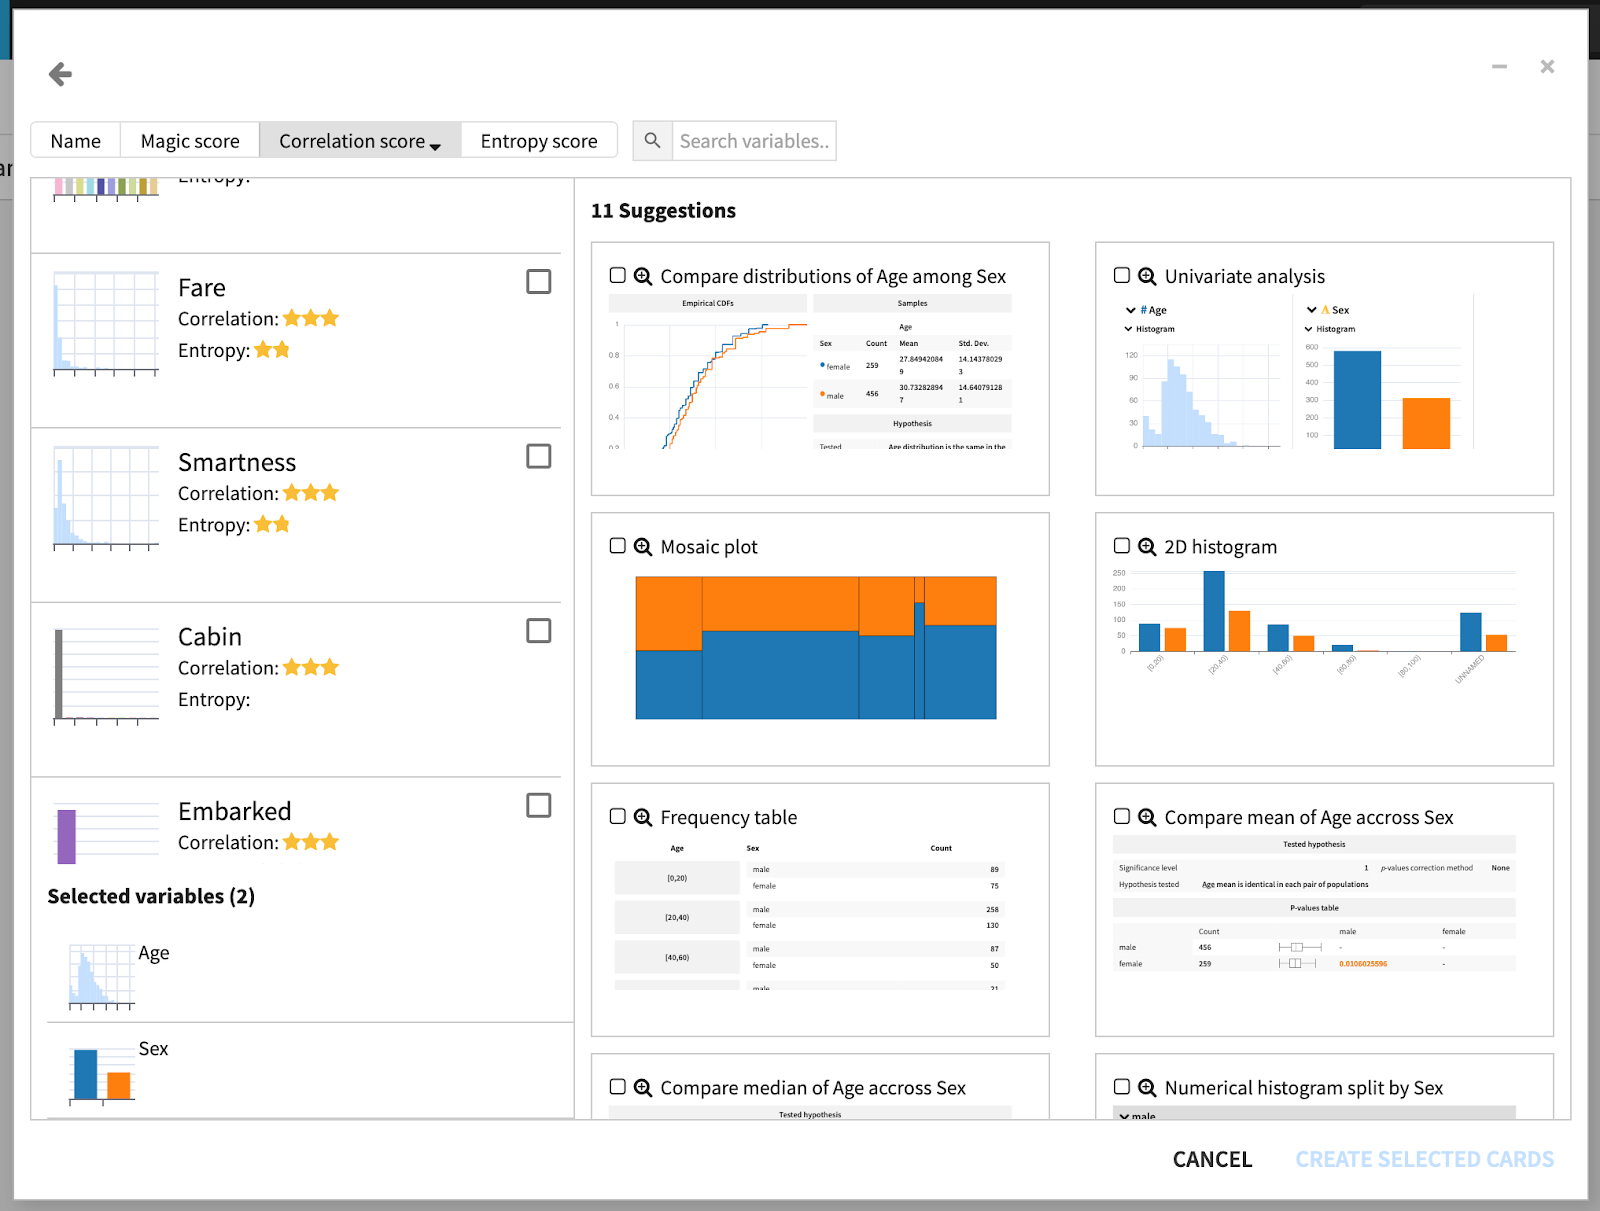
Results: The team extended Dataiku with a wizard to suggest existing as well as new EDA plots and tools. These suggestions are based both on metrics extracted from the dataset as well as the columns selected by the user.
2. Charts Public API and Automatic Chart Generation
Team: Alex Combessie, Stan Guinel, Manhulay Siriphol
Starting point: Dataiku offers great visualization capabilities — it’s really intuitive and simple to build charts by just dragging and dropping dataset columns. The team wanted to create an option to build charts programmatically.
Hakaiku team goal: Enable coders to leverage these awesome charts by implementing a public charts API.
Expected use case: Help drive the adoption of charts from developers and data scientists.

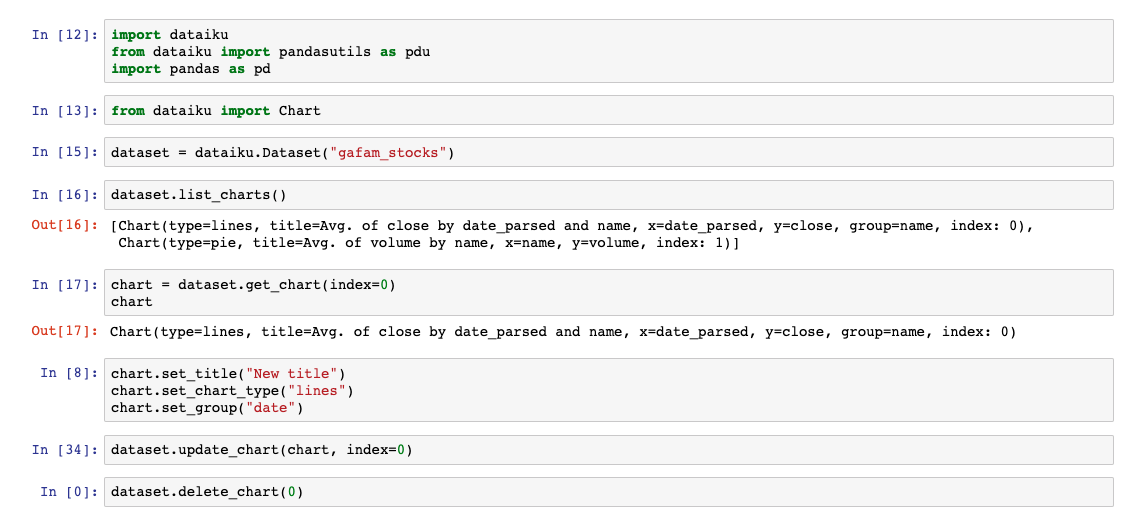
Results: The team created an API that allows coders to create, edit, copy, and delete charts from Python code. Through this new API, coders can now present their work to analysts visually, boosting project collaboration. It also helps automate the chart creation process that can sometimes be quite redundant for analysts.
3. Stress Tests Center for ML Models
Team: Jane Bellaiche, Léo Dreyfus-Schmidt, Simona Maggio, Du Phan
Starting point: Stress tests and model reliability issues currently are a hot topic in the industry. We also felt it made sense to pursue the MLOps efforts Dataiku is supporting and to build something genuinely useful for data scientists.
Hakaiku team goal: Provide a tool to simulate realistic data corruptions/changes that might occur at deployment time in order to evaluate the impact of these perturbations on a ML model.
Expected use case: Basically help Dataiku users answer the question, “Is my model robust?”
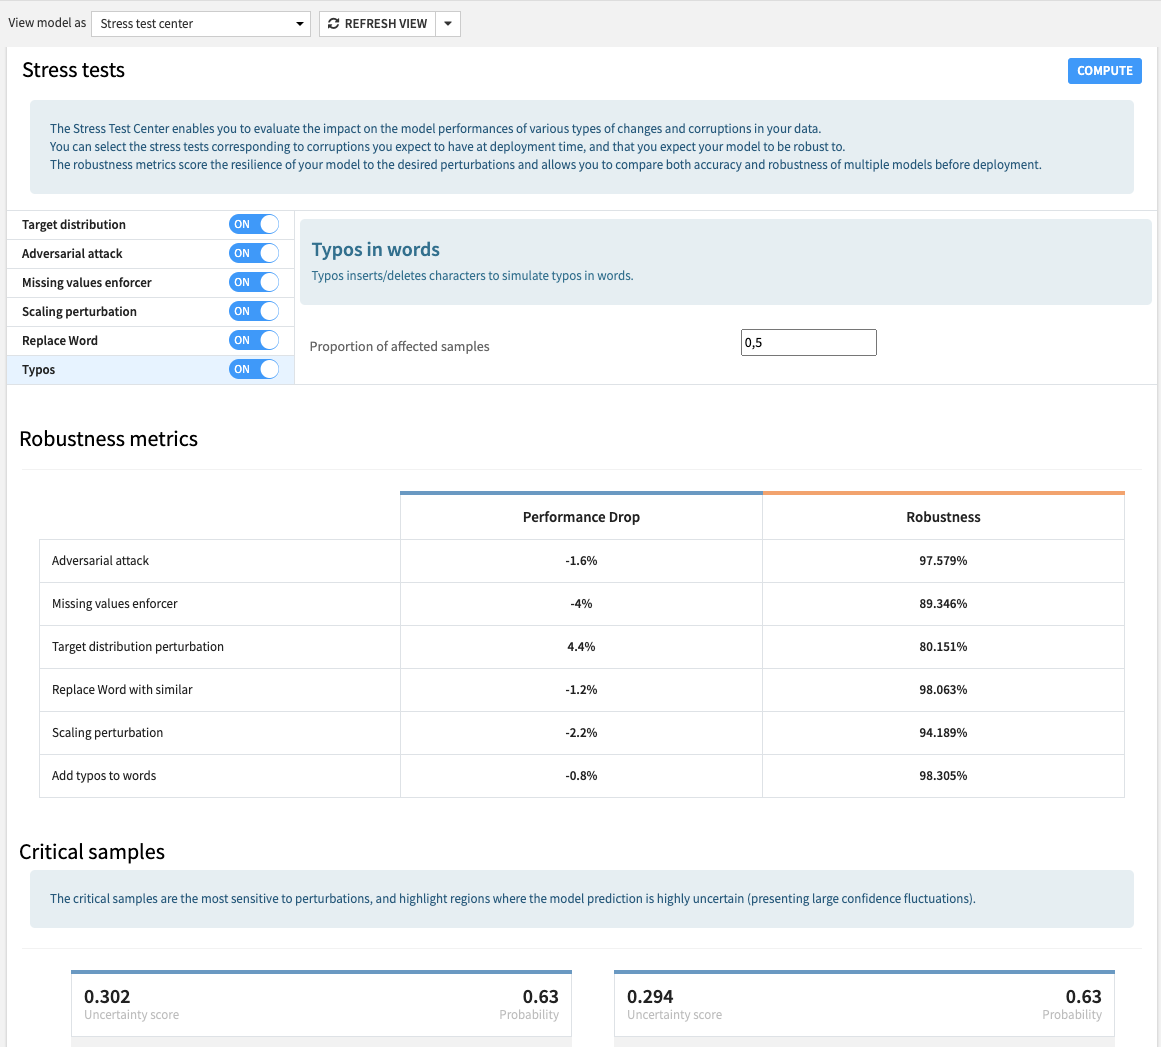
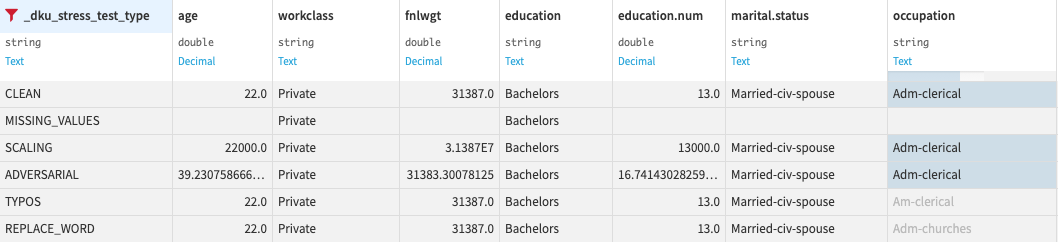
Results: The team created a Dataiku plugin that opens a Stress Tests Center webpage for any Dataiku model, where the user can select and tune the desired perturbations, run the stress tests, and check out the robustness metrics. The user can also use a recipe in the flow to stress test NLP models. Among the perturbations included there are missing values, outliers, adversarial attacks, and text attacks, such as replacement with similar words or typos.