


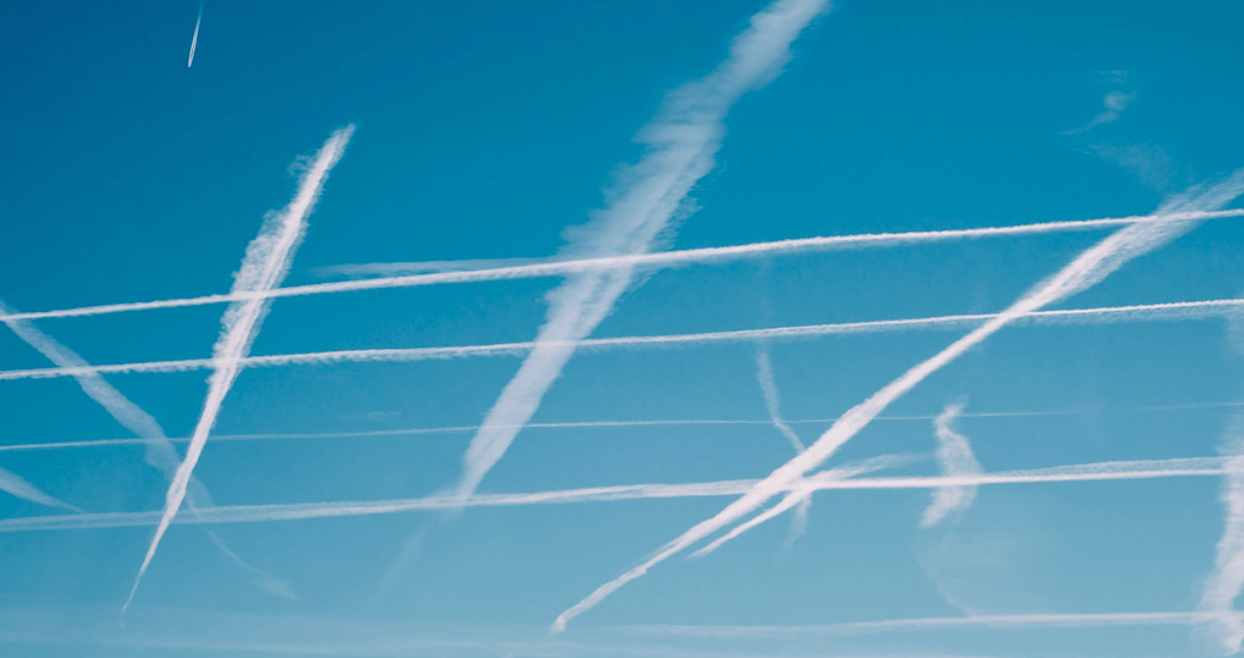
Have you ever gazed up at the sky, watching those mesmerizing white trails left behind by airplanes? These are contrails, short for condensation trails and, believe it or not, they pack quite a punch when it comes to affecting our planet. In fact, the fluffy lines contribute to around 50% [1–3] of the radiative forcing that stems from aviation! Hence, reducing these contrails could be one of the most promising strategies to shrink the carbon footprint of this sector.
In this line of work, Google Research launched a Kaggle segmentation competition a few months ago to better identify contrails in satellite imagery. This is key to validating other models that predict when and why contrails appear.
So, let’s explore what we can learn from this competition about contrails and how to detect them by looking at the top-ranking approaches. Buckle up, because we’re about to explore the skies and unravel the mysteries of contrails!
Understanding Contrails
The Contrails, Why Do They Matter?
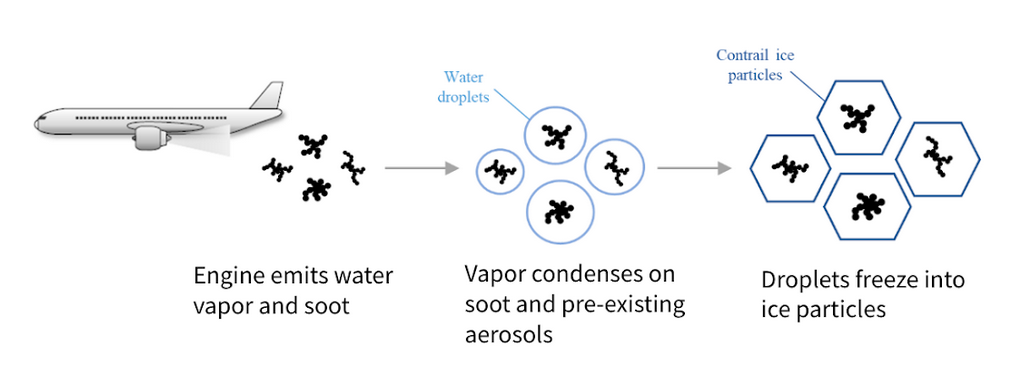
When flying, planes leave behind a mixture of water vapor and carbon dioxide from their engines. These engines also spew out soot particles, remnants of incomplete fuel combustion. The water vapor then condensates around the soot particles — cloud condensation nuclei — and freezes if the temperature is low enough. Voila! You’ve got yourself a contrail [4]. These trails can either stick to their defined lines, known as persistent contrails, or spread into extensive contrail cirrus clouds.
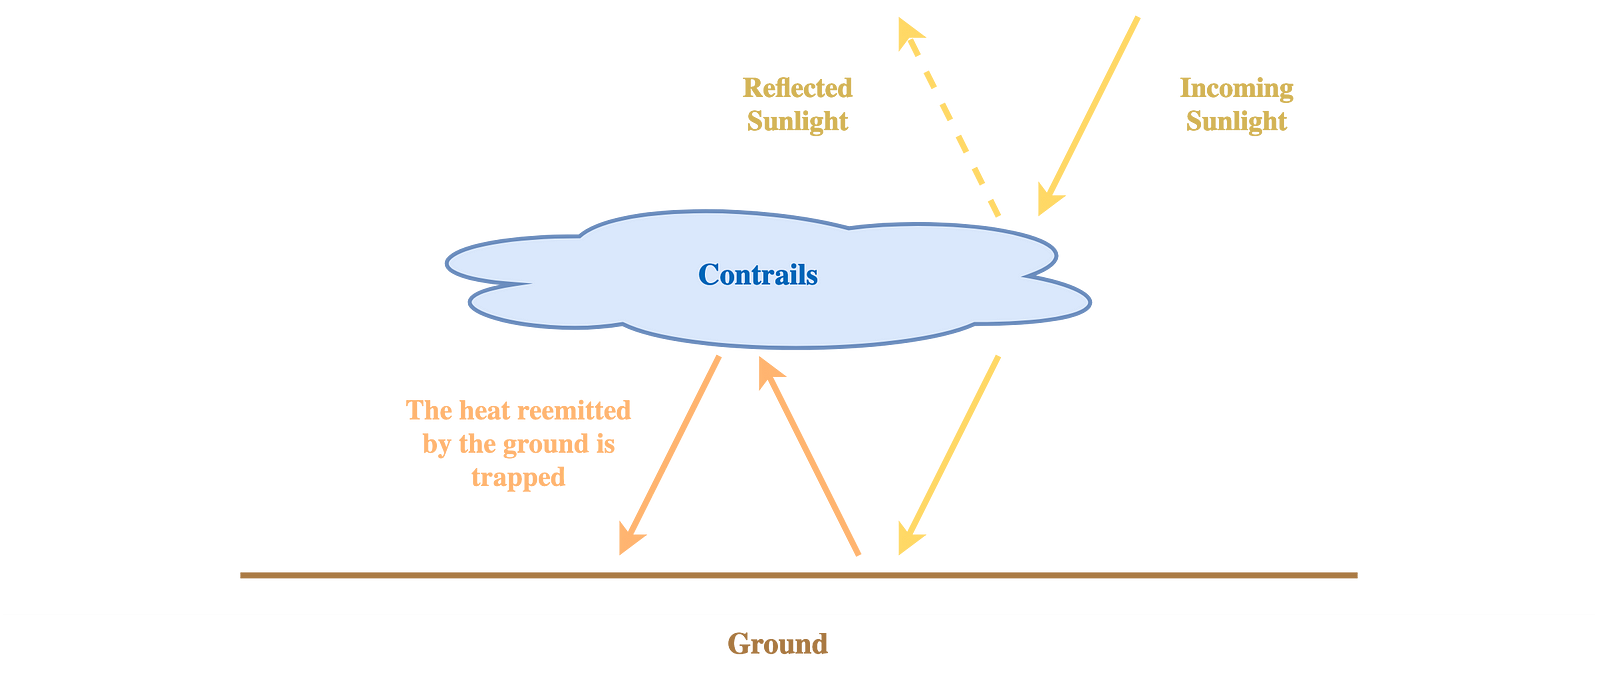
These contrails act as heat-trapping blankets, thwarting the heat that would typically escape and failing to reflect enough direct sunlight to offset the warmth. Hence, at night time, contrails hold onto heat without giving any of it back. To make matters worse, contrails cirrus closely resemble traditional cirrus clouds, making them a tricky puzzle to detect.
How Can We Reduce Contrails Formation?
But now, how do we tackle these sky-high problems?
We can divide contrails’ reduction into three research areas:
- The development of ‘sustainable aviation fuels’ (SAF’s): These fuels not only reduce the carbon footprint during production and combustion but also result in fewer soot emissions and, in turn, fewer contrails [5,6]. However, bio-based SAFs raise concerns about land usage and competition with vital resources like food and water. Cost also remains a significant barrier to their deployment [1].
- Engine optimization: Engines can be optimized to slash incomplete combustion and the subsequent soot generation.
- Plane-rerouting: Contrails thrive in icy, supersaturated air below a specific temperature [4], and these potential areas only extend to a few hundred meters vertically. A study even revealed that a mere 12% of flights in the Atlantic zone were responsible for a staggering 80% of contrail-caused radiative forcing [7]. Subsequently, only rerouting a few planes on a few hundred meters could reduce contrails creation. This research avenue could offer a scalable and cost-efficient solution. However, this path depends heavily on meteorological models to predict contrail hotspots [8,9].
For these approaches and especially plane rerouting, having a model identify contrails from satellite imagery can be helpful for automatically assessing the reduction in contrails yielded.
Navigating the Competition Insights
Let’s now explore the competition and what we should remember from the best solutions!
Every Detail Matters
Unlocking the nuances of data is no small feat — a fact that should never be underestimated. The devil, after all, resides in the details.
The available dataset is the OpenContrails dataset [10], made of 20,000 samples of satellite imagery that come from the geostationary satellite instrument GOES-16 ABI, flaunting 16 spectral bands in the visible and infrared spectrum. Here, we only have access to the eight last infrared bands.
Each sample comes with eight frames taken at 10-minute intervals, the fourth being labeled, while its three predecessors and four successors lend temporal context but are unlabelled. Additionally, each sample boasts labels from four annotators and one ground truth (labeled as contrail when more than half of the labelers agreed on it). The ground truth is a mask of semantic segmentation where each pixel is either labeled as contrail or as background.
Interestingly, each of these components was instrumental in climbing the competition’s leaderboard.
Strikingly, the most accomplished solutions avoided using raw eight-channel satellite images. This approach proved complex and ineffective. Instead, they used color schemas—mathematical operations on layers— frequently employed in climate science for satellite data visualization and analysis (in a previous blog post, we mentioned spectral methods to identify floating algae). Even if some schemas have been developed for clouds that share similarities with contrails, the best-performing schema was an ash schema (proposed initially to identify volcanic ash and sulfur dioxide clouds), then tailored explicitly for contrails [11].
Furthermore, upon careful examination of the images, some participants discerned a minor gap of 0.5 pixels between the mask and the ground truth (as illustrated below). Consequently, when rotation augmentation was applied (either during training or at test time), model performance was abruptly deteriorating! In response, the first and fifth contestants addressed this issue by simply readjusting the mask.
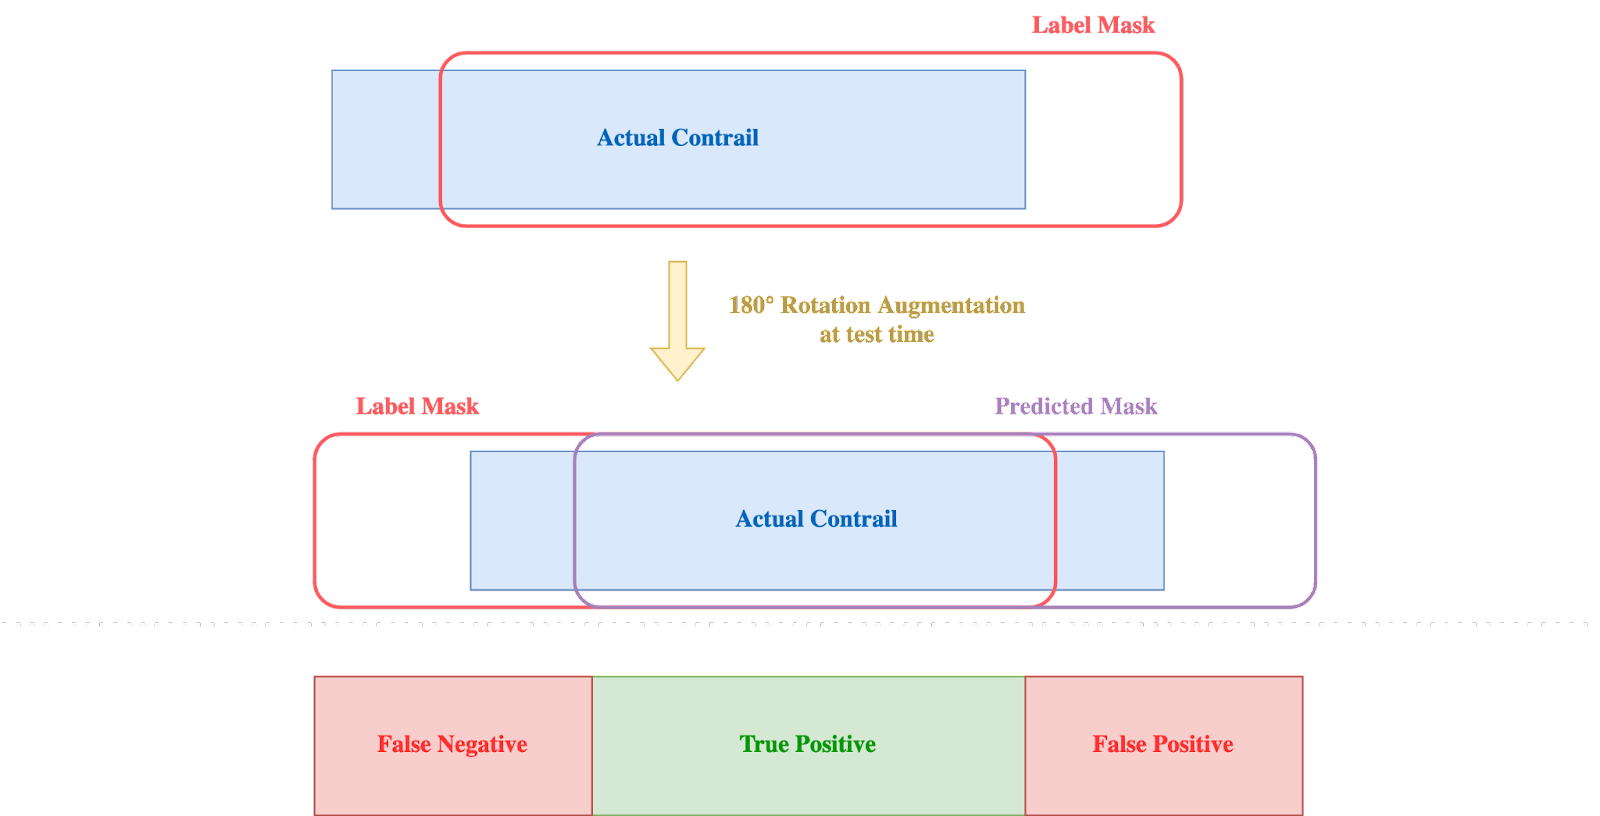
This divergence in the masks brings attention to the constraints of annotated data, where specific labels can be erroneous. Moreover, it underscores the challenge of achieving flawless data collection due to the inherent limitations associated with various tools and labeling software.
UNet: Still the Name of the Game
While the UNet architecture continues to dominate the field for segmentation tasks, the architecture of its encoder now leverages the latest advances in computer vision. Here are three of the most used architectures in the top solutions:
- EfficientNet V2 [12]: This evolution of EfficientNet combined MBConv and FusedMBConv (i.e., removing some of the depthwise convolutions) through neural architecture search, resulting in improved performance with fewer parameters.
- CoAtNet [13]: A network that combines depthwise convolutions (MBConv) and self-attention. According to the second place solution, this approach was well suited for contrails’ identification as convolutions allow pixel-level accurate prediction (contrails are only a few pixels thick) while attention allows global dependencies (contrails can be very elongated).
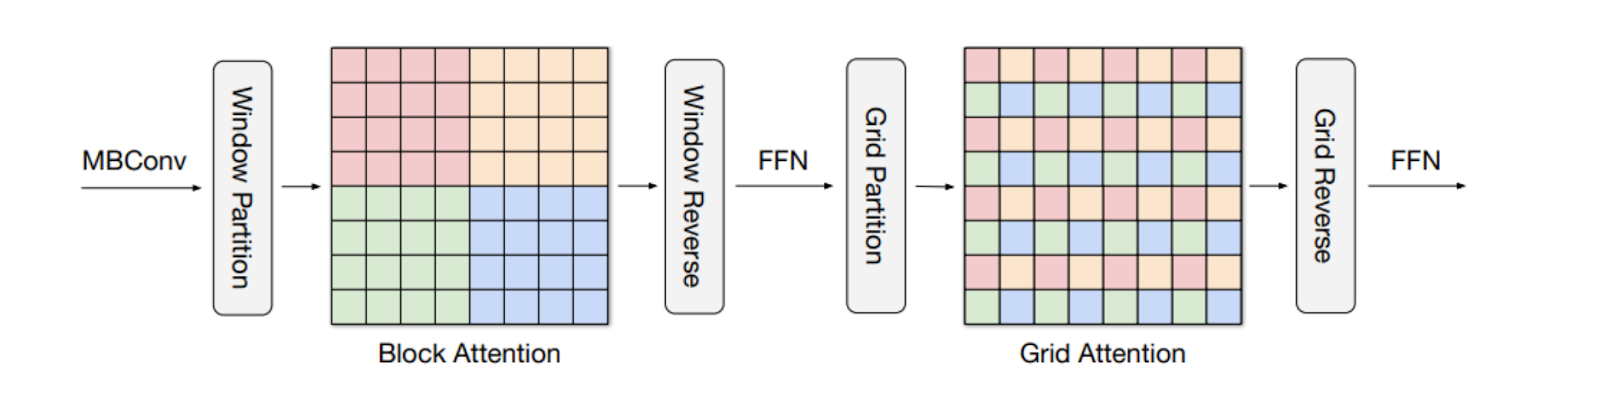
- MaxVit [14]: As for CoAt, it combines MBConv with attention, but they alternate block attention (attention on small non-overlapping patches) and grid attention (attention on a sparse grid) to capture both local and global patterns.
Optimization Is the Key
Traditionally, the loss, learning rate, and optimizer are known to be the first hyperparameters to tune in a neural network. In this competition, the best-performing solutions often used custom losses and recent optimizers.
Regarding the optimizer, the time-tested AdamW optimizer retained its stature [15]. However, the LION optimizer [16] introduced a few months ago by Google Brain showcased superior results along with a critical speedup and was used in the 5th solution. The over9000 optimizer, a combination of RADAM, LAMB, and LookAhead, also yielded good results in the second solution.
In terms of loss functions, leveraging all four available masks rather than relying solely on the majority vote ground truth improved performance. One option was to use two loss terms (one for the ground truth and one for the individual masks in a multilabelling fashion). A second one, more publicized in the competition, was to smoothen the loss function by using soft labels (averaging the individual masks instead of the majority vote), allowing regularized training and better generalization.
Additionally, several approaches suggested a composite loss function that merges binary cross-entropy (the typical choice, also employed in the best solution) with various other segmentation loss types, including:
- The Dice Loss [17] measures overlap between masks, rendering it particularly valuable for addressing imbalanced segmentation scenarios.
- The Focal Loss [18] penalizes the simpler background pixels to enhance the model’s focus on other classes.
- The Lovasz-softmax [19] loss stems from submodular losses and is tailored to optimize the mean Intersection over Union (IoU) metric.
Augment Your Dataset in Every Possible Way
Even if the dataset with 20,000 examples was already significant for traditional UNet architectures, heavily increasing its size proved to be instrumental in optimizing end performance.
Most solutions reported enhanced outcomes by employing data augmentation techniques such as shift, scale, rotation, and flip (assuming the mask shift was addressed).
Furthermore, adopting test-time augmentation (TTA) — the practice of applying multiple augmentation approaches during inference and subsequently aggregating predictions through averaging or majority voting — further elevated the final model’s efficacy.
Pseudo Labeling emerged as another strategy frequently explored within top-ranking solutions. Pseudo-labeling is a case of semi-supervised learning wherein labels are predicted for unlabeled data and incorporated into the training dataset. For this, competitors used the unlabeled frames (constituting 7/8th of each sample) from the existing dataset or external contrail data such as the Contrails GOES16 Images May dataset.
Accounting for Temporal Dependencies
As mentioned, the training dataset comprised eight frames to enhance contrail identification. Notably, labeling guidelines stipulated that contrails should manifest in at least two frames (with a 10-minute interval between each), suddenly emerging or entering from one side of the image.
However, the efficacy of conventional temporal techniques like stacking frames as channels within a 3D-UNet or employing ConvLSTM to process frames sequentially appeared limited.
The second-place solution highlighted that early temporal fusion wasn’t optimal due to substantial contrail displacement between frames. Yet, according to the contestants, the intermediate feature maps seemed roughly aligned. Consequently, they proposed to incorporate temporal mixing in the middle of the network through a 3D convolutional module or an LSTM. A relatively similar approach was also adopted by the third and fifth solutions.
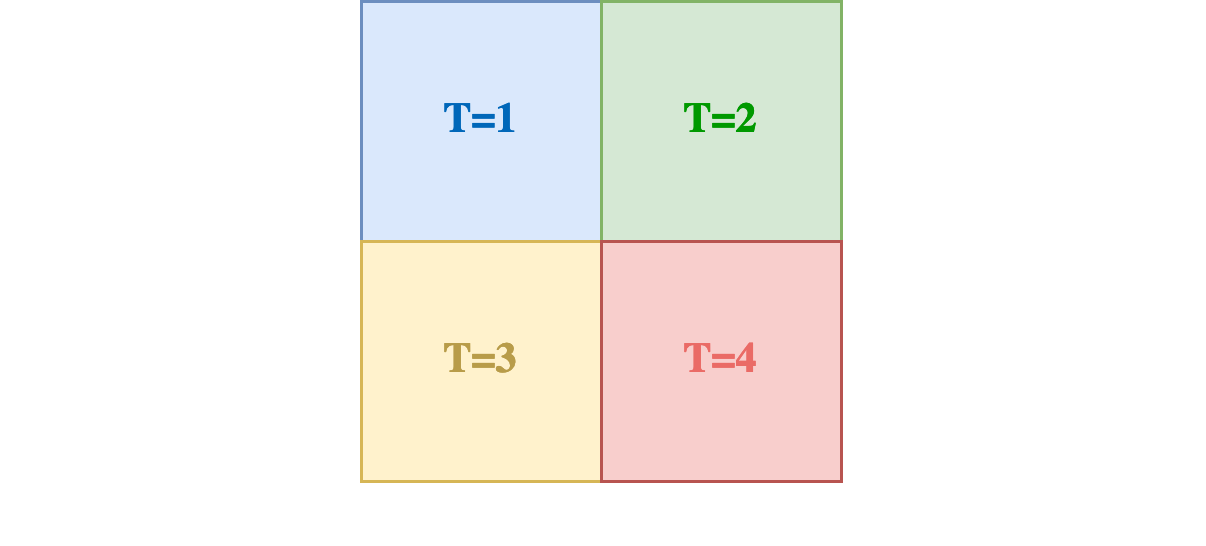
The best contestant, however, introduced a rather original approach by spatially combining frames in the spatial dimension rather than stacking them over the channels. As a result, four frames, each sized 512x512, were transformed into a single 1024x1024 image. This strategy, combined with the block and grid attention of the MaxVit architecture, seemingly enabled the simultaneous examination of individual frames alongside the exploration of temporal dependencies.
Conclusion
Delving into contrail identification through satellite imagery has provided us valuable insights into the complexities of this issue and the potential strategies for addressing it. By examining the top-ranking solutions, we’ve gained a deeper understanding of the factors at play and the innovative techniques data scientists employ to tackle this challenge. Learning about contrails, their formation, and their impact on our climate underscores the importance of finding effective ways to reduce their occurrence.
If entering the competition interests you, check out this Kaggle notebook. It guides you through every stage, from exploratory data analysis to submitting your predictions.
[2] Lee, David S., et al. “The contribution of global aviation to anthropogenic climate forcing for 2000 to 2018.”
[3] Digby, Ruth AR, et al. “An observational constraint on aviation‐induced cirrus from the COVID‐19‐induced flight disruption.”
[4] Kärcher, Bernd. “Formation and radiative forcing of contrail cirrus.”
[5] Bier, Andreas, Ulrike Burkhardt, and Lisa Bock. “Synoptic control of contrail cirrus life cycles and their modification due to reduced soot number emissions.”
[6] Bier, Andreas, and Ulrike Burkhardt. “Variability in contrail ice nucleation and its dependence on soot number emissions.”
[7] Teoh, Roger, et al. “Aviation contrail climate effects in the North Atlantic from 2016–2021.”
[8] Gierens, Klaus, Sigrun Matthes, and Susanne Rohs. “How well can persistent contrails be predicted?.”
[9] https://sites.research.google/contrails/
[10] Ng, Joe Yue-Hei, et al. “OpenContrails: Benchmarking Contrail Detection on GOES-16 ABI.”
[11] Kulik, Luke. “Satellite-based detection of contrails using deep learning”
[12] Tan, Mingxing, and Quoc Le. “Efficientnetv2: Smaller models and faster training.”
[13] Dai, Zihang, et al. “Coatnet: Marrying convolution and attention for all data sizes.”
[14] Tu, Zhengzhong, et al. “Maxvit: Multi-axis vision transformer.”
[15] Loshchilov, Ilya, and Frank Hutter. “Decoupled weight decay regularization.”
[16] Chen, Xiangning, et al. “Symbolic discovery of optimization algorithms.”
[17] Sudre, Carole H., et al. “Generalised dice overlap as a deep learning loss function for highly unbalanced segmentations.”
[18] Lin, Tsung-Yi, et al. “Focal loss for dense object detection.”
[19] Berman, Maxim, Amal Rannen Triki, and Matthew B. Blaschko. “The lovász-softmax loss: A tractable surrogate for the optimization of the intersection-over-union measure in neural networks.”