


What happens when AI systems make a mistake? Why does that matter? Well, the mistakes can result in significantly impactful errors that cause harm, a very palpable risk for organizations across industries, from healthcare and finance to marketing and retail.
One way to mitigate the negative impacts and generate more positive ones from our AI systems is through Responsible AI, an inclusive approach to designing, building, and deploying AI that is in line with stated intentions. Practitioners are aware of the historical and social context in which they build pipelines, and use that knowledge to inform more equitable data science applications. The onus is on organizations to define a precise framework of their ethical rules that should — or should not be — followed. This ensures that the company takes a clear position on all of its principles and facilitates communication of these principles among and across all teams.
We’re excited to introduce a multi-part series on how to execute Responsible AI practices where we will highlight use cases across several industries along with actionable tips and tricks to execute within Dataiku. While there are several components to Responsible AI (i.e., risk, privacy, security, fairness, etc.), these blog posts will focus on Responsible AI as it relates to fairness and the machine learning pipeline, specifically:
- Data ingestion, cleaning, and transformation (and being confident in that data)
- Building models toward a certain goal that is explicitly stated
- Implementation and continuous monitoring
In this series, we will frame Responsible AI as part of the entire AI lifecycle. When building out AI pipelines, it is critical to embed Responsible AI in every stage, asking questions and looking for key checkpoints along the way.
Use Case #1: Medical Biases in the Healthcare Industry
Data is not neutral — it carries historical and social context and working with it is the first step of the machine learning pipeline. In this first use case, we’ll illustrate how to find biases in our data before we begin modeling through the example of medical biases replicated in algorithms in the healthcare industry.
Even as practitioners aim to reduce (and wholly eliminate) potential sources of bias, many AI pipelines continue to reproduce historic inequalities, with the U.S. healthcare industry being a prime example. Systematic racism and a history of health disparities are built into medical systems and the data they produce.
In 2019, researchers found that an algorithm used to flag patients for extra medical care was biased against Black patients, meaning that for two patients presenting the same level of illness, the model deemed the white patient more at risk and in need of extra medical attention. Black patients who were flagged for additional care were consistently more ill than their white counterparts, essentially creating two different risk thresholds based on a patient’s race. The algorithm, then, replicated existing inequalities between Black and white patients.
While it wasn’t the intent of the algorithm developers to create a discriminatory product, the lack of attention to systematic discrimination in both the data and the model design led to a less than satisfactory outcome. In this case, the issue stemmed from how the algorithm was developed. The model used a patient’s healthcare cost as a proxy for overall health needs to predict if extra care was necessary. Using healthcare costs made sense on paper — taking care of the sicker patient will cost more than someone who is not as sick. The algorithm was designed to use a patient’s prior healthcare expenses as an indicator of future costs and, in turn, their potential need for extra medical care.
The developers didn’t realize, though, that healthcare costs are tightly intertwined with a patient’s race. Mistreatment of Black patients has established widespread distrust in the medical system from many people of color, meaning they are less likely to take advantage of healthcare services unless they are at an extreme level of illness or pain. Further, different access to medical care and treatment coverage is strongly correlated with income, so low-income patients frequently deny treatment they can’t afford without insurance. Therefore, patients of color will show lower healthcare costs, even if their medical need is the same as their white counterparts. The racial difference in costs is picked up by the algorithm, even without using race as a feature of analysis.
The algorithm developers likely thought that by omitting race from the model inputs, they were removing a key element of bias. However, they failed to understand the context in which the data was produced and the structural inequalities rampant in the medical system, which allowed the algorithm to reproduce the same disparate treatment for people of color. Because data collection often suffers from our own bias, unfairness can often be explained at the very source of any machine learning project: the data. These three causes of unfairness may have been at work in the example outlined above:
- Proxies: Even if protected sensitive attributes (race, gender, etc.) are removed before training a model, the model can still perform poorer on minority classes than on the overall population. These differences in performance might be explained when remaining features act as proxies of the protected attribute.
- Skewed samples: These are a direct consequence of using a data collection process that is already biased because of other causes of unfairness, such as limited features. The biased data collection may lead to biased models, and, when business decisions are based on such models, their consequences might have an adverse impact which will reinforce this data bias. This can be called a biased feedback loop.
- Tainted examples: In supervised learning tasks, it’s critical that the targets of the classification tasks are correct. However, tainted examples are a result when the target isn’t well-defined or the features are biased.
Do It in Dataiku!
In the healthcare use case, the failure to acknowledge and account for existing areas of inequality led to the inevitable further discrimination within the AI pipeline. Here, we’ll highlight a few ways to put this into practice in Dataiku. However, it’s important to note that there are many approaches to doing this work and this is not meant to be an exhaustive list, but rather some first steps to get started.
Let’s look at an example using hospital admissions data. Our data comprises 40,000 unique admissions for patients suffering from diabetes across the state of New York. The data includes demographic information like race and gender, as well as measurements of medical information such as resting blood sugar and heart rate. Each patient has a value for ‘Support Flag’ which indicates whether or not the patient received additional support services from medical staff. In our use case, we would like to use this data to predict whether patients will need additional medical support at the time of entry to the hospital. Ideally, this predicted Support Flag will reduce the number of fatalities and readmissions by flagging at risk patients earlier in their stay at the hospital.
Building a model on this kind of data can be both powerful and dangerous, especially if the underlying data carries hidden bias. Below, we document three different ways to explore the biases in your dataset before beginning any models.
1. Exploratory Data Analysis (EDA)
EDA is an important step in any data analysis, but in the case of Responsible AI it can be a good way to narrow the search for underlying biases. In Dataiku, you can conduct EDA using an interactive statistics worksheet. Teams can leverage this feature to:
- Summarize or describe data samples
- Draw conclusions from a sample dataset about an underlying population
- Visualize the structure of the dataset in a reduced number of dimensions
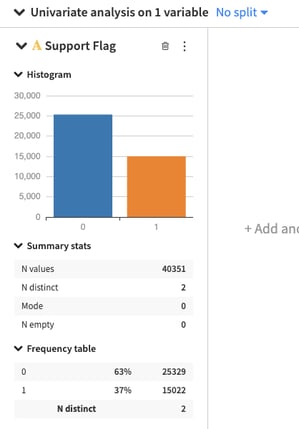
After importing our dataset into Dataiku, we can navigate to the Statistics Tab from the explore menu. Here, we can create our first worksheet using a variety of methods. Let’s start with some simple univariate analysis to explore the distribution of our outcome variable Support Flag. By default, the worksheet will use a sample of 100,000 records from the data to compute the analysis.
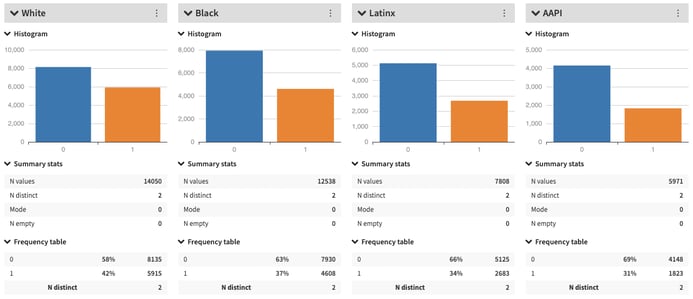
Below, we can see the overall distribution of the Support Flag in the dataset, with only 37% of all patients requiring extra care. This reflects some expected unbalance in the data, but we should confirm that the unbalance is equal across various groups of interest. For instance, select the ‘No Split’ tab on top of the chart, and use the drop down to explore the breakdown in support between male and female patients. We can see that the distribution of the Support Flag is very similar across the two populations.
Now, change the split to the Race variable. As the graph shows, the proportion of patients that received extra care is higher than the group average for white patients. For Latinx and Asian American patients, the proportion of patients receiving extra care is lower than average. The difference in care could in fact be a function of the type of patients that were admitted to the hospital, or it could reflect underlying biases in the healthcare system that prioritize certain patients over others. Whatever the cause, without interrogating the data through the lens of Responsible AI, we will not surface these underlying skews.
2. Statistical Tests
Another set of methods to uncover bias in a dataset is the use of various statistical tests that compare the difference among groups within a dataset. Based on the type of data, these tests provide information about the data’s underlying distributions and their interpretation can indicate whether or not those distributions are different from expected.
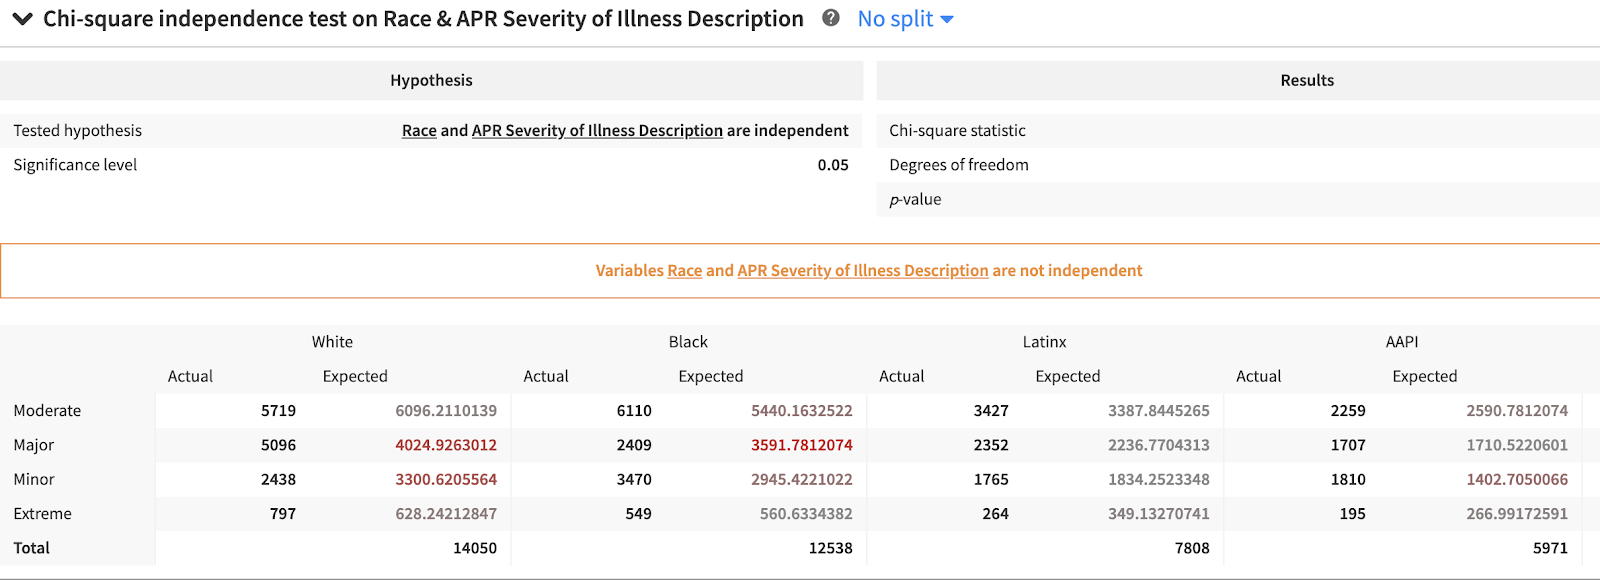
For our current use case, we will look at the Chi-Square Test statistic. This test measures whether two categorical variables are independent from one another. For example, a person’s height and weight are (generally) not independent of each other since someone’s height has a strong impact on their weight. By contrast, someone's age does not influence their eye color and we can measure whether age and eye color are independent using the Chi-Square Test. This test will measure the difference between actual versus expected distributions in a dataset. If the difference is significant according to the test statistic, we can reject the idea that two variables are independent of one another. These types of significance tests are one way to look for potential proxy variables in your dataset.
It is important to note that proxy variables can be difficult to uncover especially when data comes from a variety of sources and represent complex social structures. A combination of subject matter expertise and continued interrogation of the data are necessary to explore all potential biases.
3. Disparate Impact
Disparate impact is a method to determine imbalance in a dataset that has become popular in the Responsible AI literature over the past few years. Disparate impact measures whether a sensitive group receives a positive outcome at a rate close to that of the advantaged group. A general rule of thumb is that the proportion between sensitive and advantage group members that receive the positive outcome should be at least 80%.
Let’s look back at our Support Flag outcome. Our EDA indicates that 42% of white patients received extra care, compared to 37% of Black patients. We can calculate the proportion as:
Percent of Black Patients With Support Flag ÷ Percent of White Patients With Support Flag = .37 ÷ .42 = .88
In the case of white versus Black patients, the proportion that gets extra support is above 80%, indicating low disparate impact in this case. By contrast, 32% of Asian American patients get extra care and, when compared to white patients, the proportion of .32/.42 results in a DI measure of .76, and indicates disparate impact of the Support Flag between these two groups. This means that the distribution of the Support Flag reflects a bias, which could affect how well a model performs down the line.
Disparate impact is an interesting concept in the Responsible AI space, but the question of what percentage qualifies as disparate impact is still under debate. As data practitioners, you will have to judge whether the 80% rule is adequate in determining the amount of bias in a dataset, or if a more stringent definition is necessary.
Conclusion
We hope you find these initial ways to look for bias in data (such as in the healthcare space) helpful. It is important to remember that there is no silver bullet and that this work toward more responsible systems needs constant evaluation.
* 1. Hoffman, Kelly M., et al. "Racial Bias in Pain Assessment and Treatment Recommendations, and False Beliefs About Biological Differences Between Blacks and Whites." Proceedings of the National Academy of Sciences 113.16 (2016): 4296-4301.
2. Sabin, Janice A., and Anthony G. Greenwald. "The Influence of Implicit Bias on Treatment Recommendations for 4 Common Pediatric Conditions: Pain, Urinary Tract Infection, Attention Deficit Hyperactivity Disorder, and Asthma." American Journal of Public Health 102.5 (2012): 988-995.
3. FitzGerald, Chloë, and Samia Hurst. "Implicit Bias in Healthcare Professionals: A Systematic Review." BMC Medical Ethics 18.1 (2017): 19.
4. Mills, Angela M., et al. "Racial Disparity in Analgesic Treatment for ED Patients With Abdominal or Back Pain." The American Journal of Emergency Medicine 29.7 (2011): 752-756.