


Discovering potential drug risks and preventing unnecessary patient harm is a top priority for pharmaceutical companies. It is a challenge that grows more complex as more drugs are brought to market; at present, there are over 19,000 drugs approved for marketing by the FDA, and around 45% of Americans take at least one prescription medication.
The human cost of adverse drug reactions (ADRs) is staggering: ADRs are a leading cause of mortality/morbidity, with an estimated 197,000 deaths annually in Europe. They pose a severe economic expense as well, accounting for at least 5% of all hospitalizations with a global economic cost burden over $1 trillion USD. Regulatory mandates requiring drug manufacturers to report potential adverse drug reactions have led to the curation of large public databases, such as the FDA Adverse Event Reporting system (FAERS), that provide a rich source for data mining to discover novel signals.
Developing a swift-footed and reliable pharmacovigilance strategy, as many industry experts know, is the key to identifying potential drug risks and acting on them. And any good strategy will need to find answers to three key questions:
- What patterns and trends exist in safety reports for my marketed drugs (and comparators)?
- Are there certain subpopulations at risk of serious adverse drug reactions that clinical research did not reveal?
- How can I quickly automate data cleaning and processing to triage case management and address potential safety signals as early as possible?
Tackling these problems is a high-reward endeavor and should be a priority for any pharmacovigilance team.
The Value of High-Quality Pharmacovigilance
The most obvious benefit of a well-oiled pharmacovigilance strategy is that it will detect drug risks early and enable immediate insights for preventing undue or unanticipated harm. But the advantages go beyond speed: Importantly, good pharmacovigilance is essential for deriving a realistic benefit-risk profile of drugs in diverse real-world populations — often under-served in clinical trials operating under rigid inclusion-and-exclusion criteria and time limitations.. This is crucial for informed market access and patient engagement, which allow for improved health outcomes while minimizing patient harm.
Drug safety analysts will also be better equipped to detect dangerous drug interactions or drug misuse, and to inform potential new indications from off-label treatment trends. And the entire team will be better prepared to work with the rest of the company on getting ahead of lengthy regulatory and/or legal processes related to drug recalls. They will thus be able to take early action on, for example, issuing safety related label changes, and will be better positioned to protect brand identity and the company’s reputation.
But pharmacovigilance specialists, drug safety analysts, and IT managers alike know that obtaining actionable insights from public spontaneous reporting systems (SRS) like FAERS is easier said than done. To derive the maximum value of a high-quality pharmacovigilance strategy, and to tackle the complex data processing, integrity and quality issues in individual case safety reports (ICSR), an automated pipeline is critical. That way, safety signals can be identified quickly and reliably.
Taking Pharmacovigilance to the Next Level With Dataiku
Here’s where Dataiku comes in. Our Pharmacovigilance Solution — designed with these goals and strategies in mind by industry experts — provides a ready-to-use application to ingest adverse drug reaction safety reports, process and clean the data, and generate safety insights of potential signals that inform drug risk profiles.
The solution is easy to install and set up on your Dataiku instance. It enables data managers to seamlessly connect to FAERS and FDA drug data sources and allows drug safety analysts to select the safety report filters and analysis cohort parameters they require. Analyses can be run quickly and dynamically, and the outputs can be consumed via intelligent and easy-to-use data visualizations on the main dashboard.
Let’s take a look at some of the Pharmacovigilance Solution highlights in more detail:
- Quickly ingest data files extracted from the FDA Adverse Event Reporting System (FAERS) database.
- Easily process the data, detect duplicate reports, and filter on demographic, drug, reaction, and report characteristics.
- Identify and visualize patterns in safety data with Dataiku’s descriptive analytics and charts.
- Calculate common disproportionality metrics for statistical inference and signal detection.
- Achieve immediate insights with a user friendly Dataiku App to upload new quarterly data files, filter reports, generate cohort signals, and run drug/reaction analytics to ensure patient safety and increase regulatory compliance with early detection of potential ADR signals.
- Adapt/extend to other public (such as Vigibase or Eudravigilance) databases or privately curated drug safety data sources.
Solution Key Features
The solution seamlessly plugs into the Dataiku instance and is easy to adjust according to the project’s needs. Here are some of its key features.
Plug and Play FAERS Quarterly Data Files
Rapidly upload, process, clean, and filter the standard data files from the FAERS public database with a Dataiku Application.

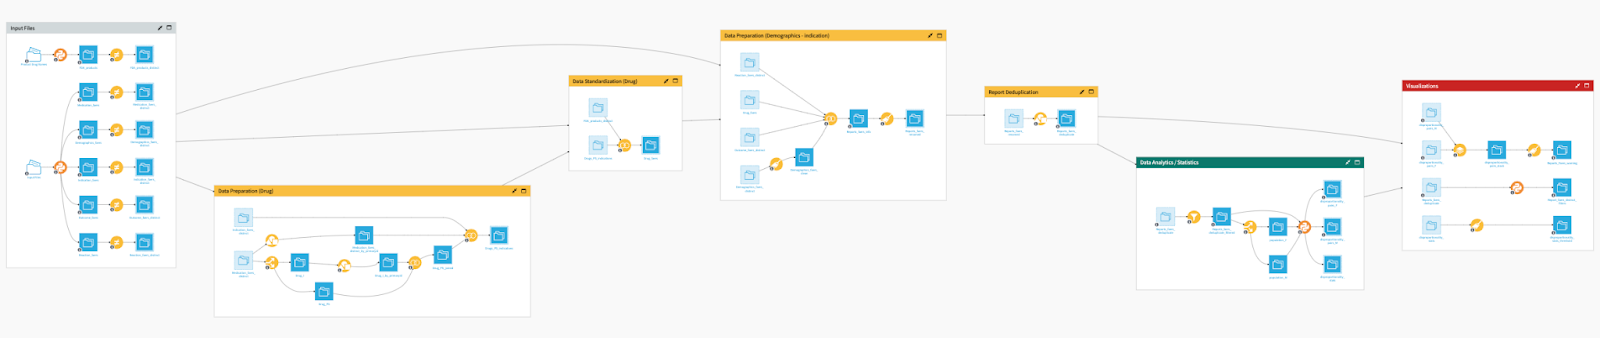
Reproducible, Automated Flow for Data Cleaning and Drug/Reaction Signal Analysis
Automate and visualize the complex data preparation process to take raw report data on drugs, indications, reactions, outcomes, and demographics to analysis-ready signal surveillance.
Generate Measures of Disproportionality (ROR, PRR, EBGM)
Understand and triage the potential drug safety signals found in spontaneously reported systems with common disproportionality metrics (relative odds ratios, proportional reporting ratio, and empirical bayes geometric mean) and descriptive analytics.

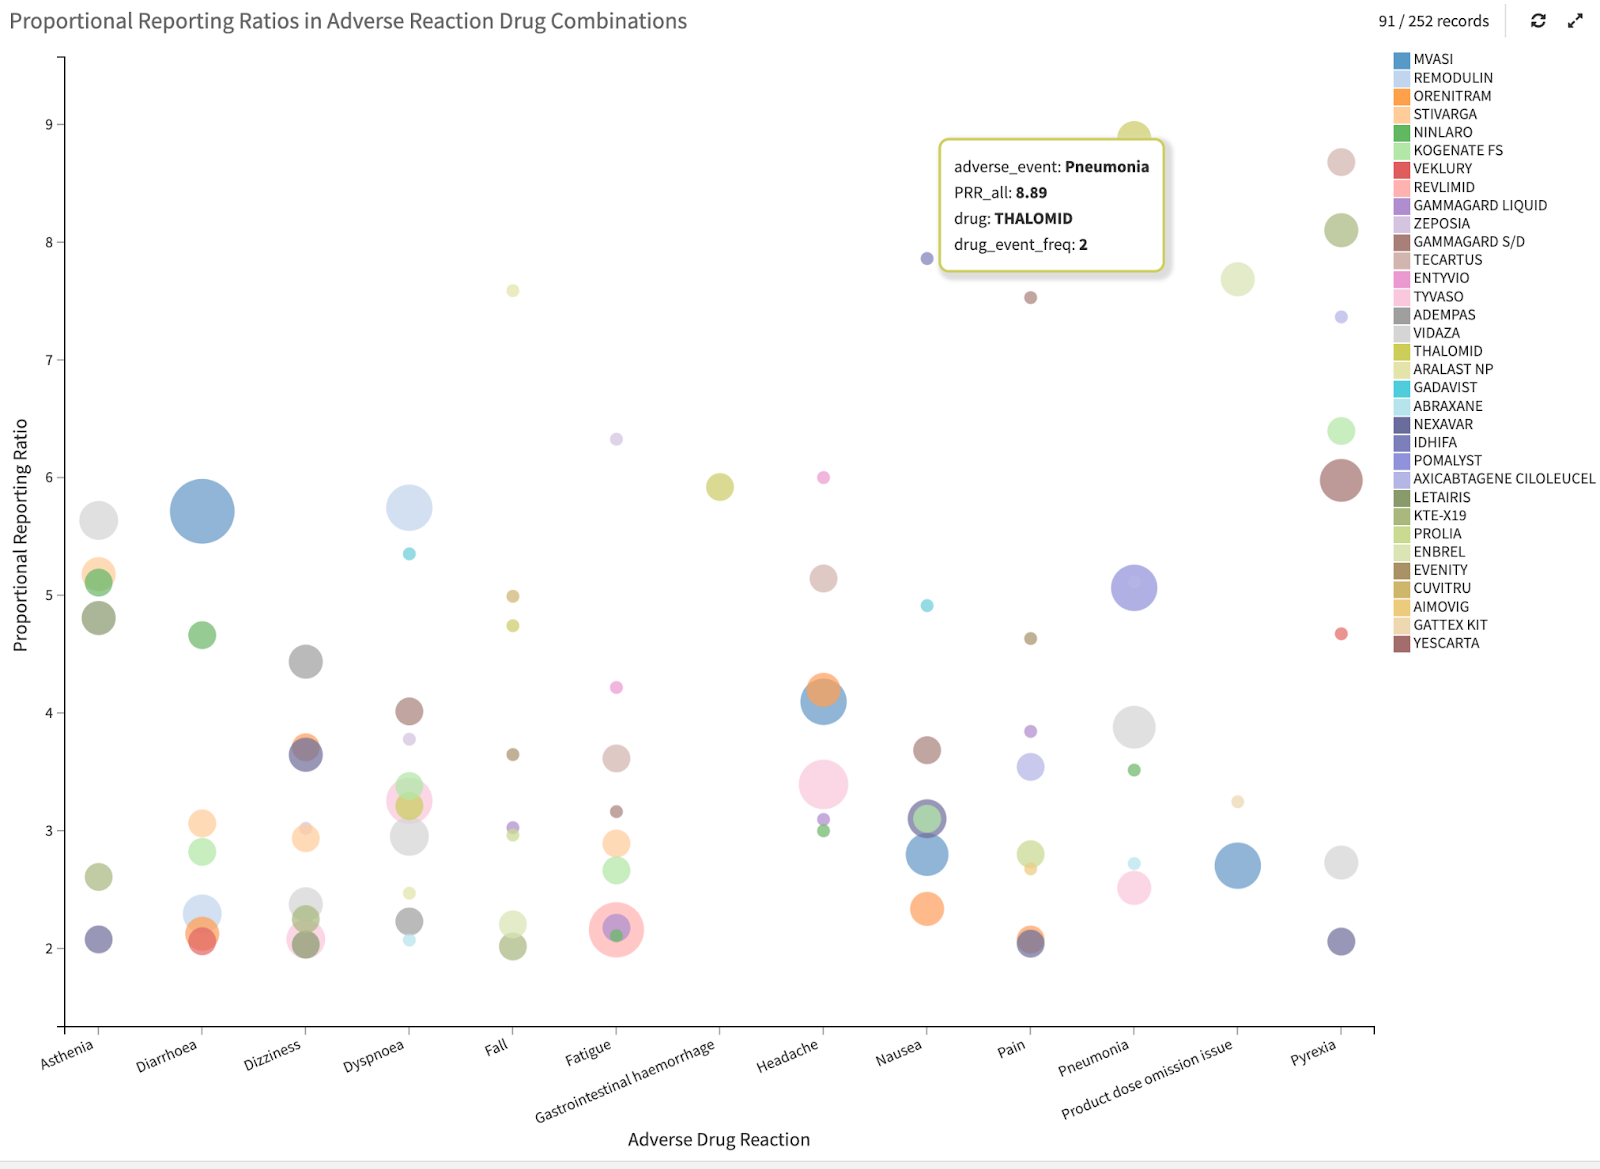
Interactive Visual Dashboards of Safety Trends
Gain the complete picture of the complex patterns and potential safety concerns particular to your therapeutic through interactive visualization to monitor and triage potential safety signals related to your brands.
Insights on Drivers of Potential Drug Safety Signals and Outcomes in Reports Across Cohorts
Discover disparate trends in adverse drug reactions across age groups and gender cohorts.

From Signals to Investigation
Easily integrate large amounts of data from spontaneous reporting systems, and just as easily push the resulting datasets into case management systems for triaged investigation.

Evolving Pharmacovigilance Solutions
Dataiku is working with Snowflake to take our pharmacovigilance solution to the next level. The forthcoming Snowflake version will accelerate compute scalability for pharmacovigilance in the near future.
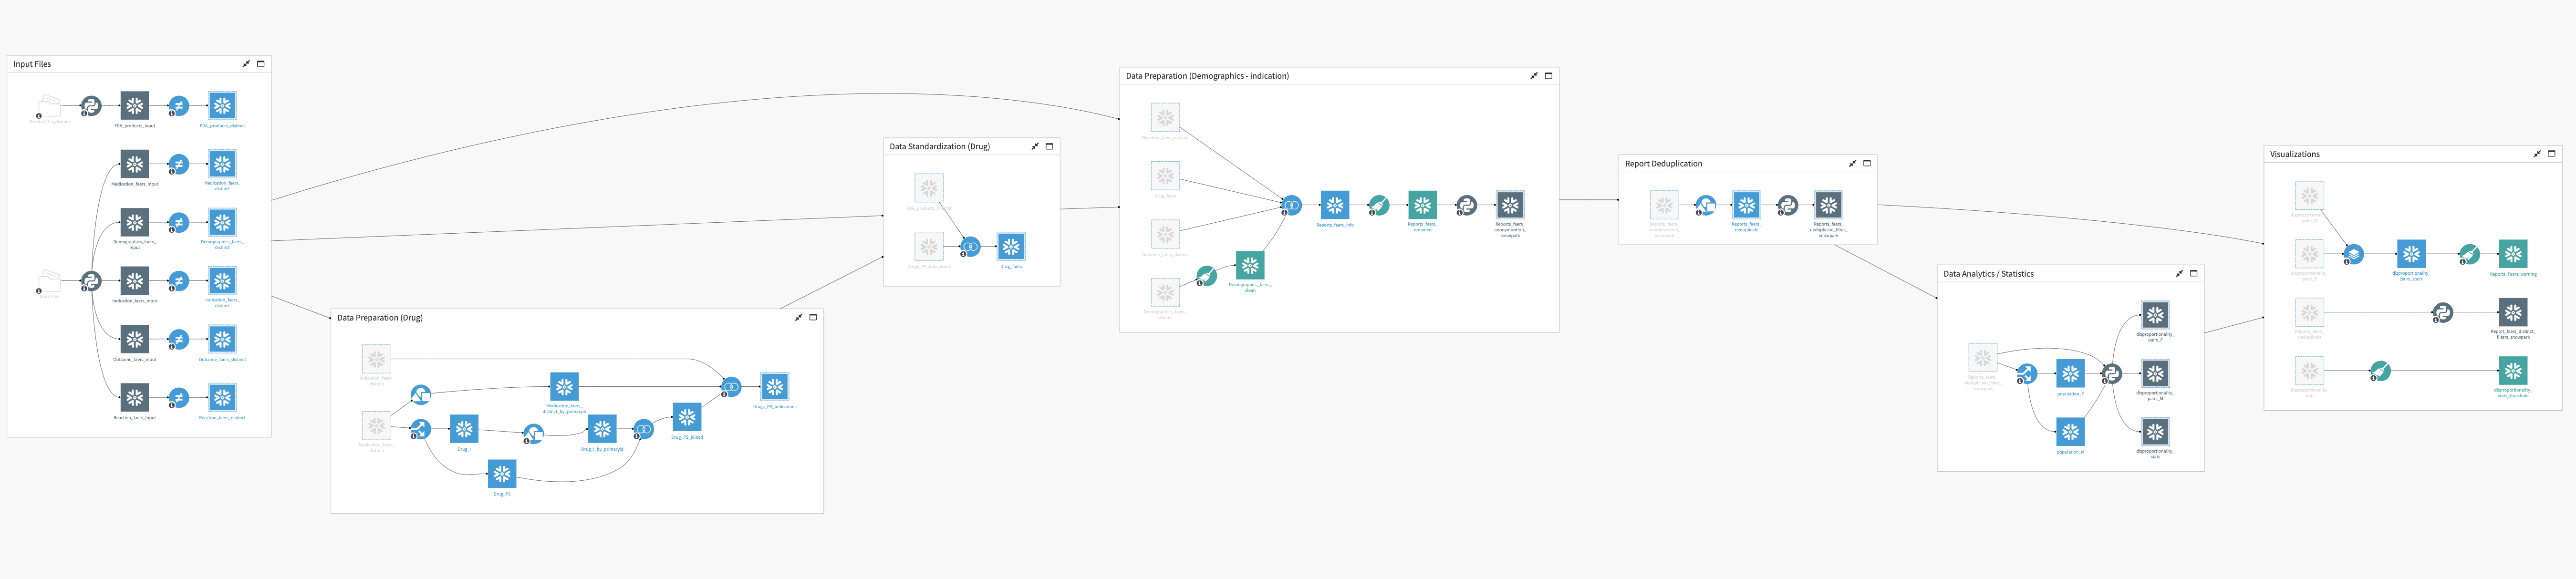
A look at the Snowflake-powered Flow. Coming soon.
Working with large input data files (safety reports grow exponentially) and developing measures to calculate disproportionality are computationally expensive. By leveraging in-database compute with an optimized use of Snowpark, the newest (forthcoming) version of this solution will enable users to computationally scale to increasingly large databases of safety reporting data.
Integrate pharmacovigilance now — with these simple requirements: