If you ever dreamed of visiting Japan, the best season is spring, when you can see the bloom of Sakura (the world-famous cherry blossom). However, you might need a little bit of luck. Sakura blooms only for a short period of time; seven days after the flowers open, they already start to scatter. There’s a big chance that you'll buy expensive flights only to miss the blossom period. This motivated me to build a prediction model for the bloom of Sakura using Dataiku — check out the steps below to see how I did it (and, of course, the results!).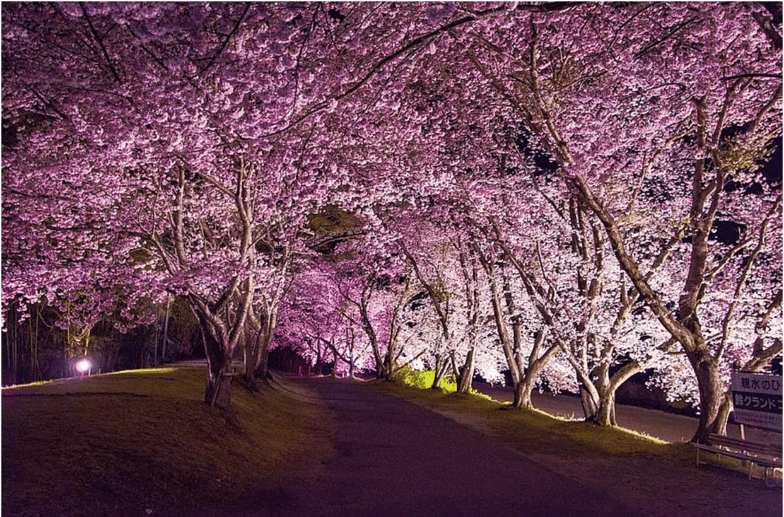
Comparison With Other Forecasts
Below are the prediction results. My prediction, Random Sakura Forest, shows that the blooming day of Oita prefecture (southern Japan) is March 22, that of Tokyo is March 21, and that of Aomori prefecture (northern Japan) is April 21. Compared to two other forecasting websites, tenki.jp and Japan Weather Association(JWA), Random Sakura Forest’s predictions are a few days behind.
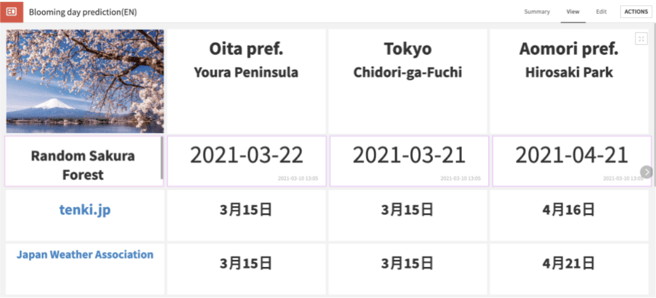
Random Sakura Forest’s prediction was made on March 10. Sakura in Tokyo bloomed on March 15, so my prediction was already proven wrong for one of the three cities. However, both of the other forecasting websites missed the forecast for the city of Oita. They predicted Sakura would bloom on March 15, but (at the time of publishing this article) it hasn’t yet. My prediction for Aomori prefecture is the same as JWA.
Advantage of Random Sakura Forest
Putting aside a severe mental breakdown for missing the prediction for Tokyo and therefore the scattered hope for the other two cities, Random Sakura Forest has one advantage:
It is a fully automated prediction system operating on a daily basis, made possible by a scenario automation feature of Dataiku. 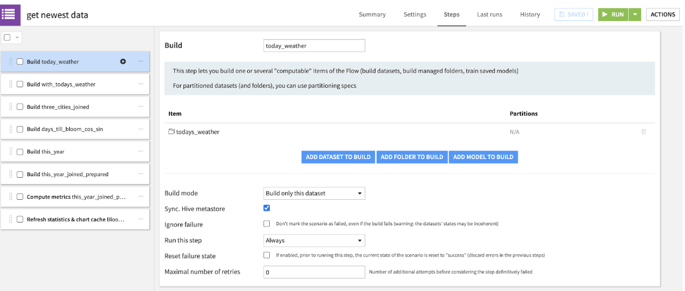
Everyday at 2 a.m., a Python recipe scrapes the weather information in the three cities from the previous day and updates the predictions like the chart below:
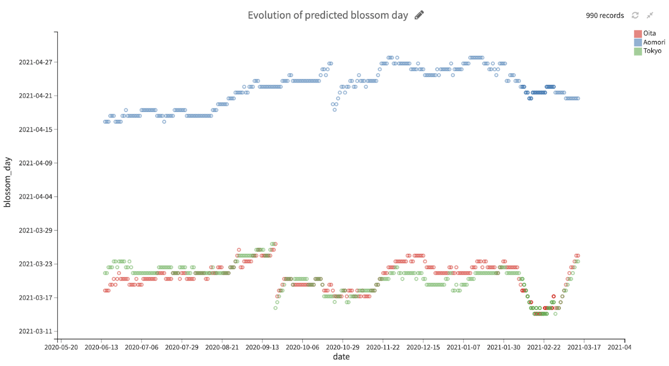
On the other hand, tenki.jp updates its prediction once a week, and JWA does it only once every two weeks. Now that many peoples' trips to Japan depend hugely on the precise blooming day, it is a big plus that you can get prediction updates every day.
The whole flow can be seen below. It consists of two zones: data pre-processing and machine learning.

Scraping Weather Data for Inputs
Below is the data pre-processing zone. The inputs are daily weather data from 1991 until today in the three cities and the historical blooming days from the past 30 years. Daily weather data is scraped from the Japan Meteorological Agency using a Python recipe, including average, highest, and lowest temperature, precipitation, and daylight hours.

Feature Generation With Window Recipe
Using a Window recipe, I generated rolling averages during the past one month, three months, and six months for each of the weather-related variables for each of the three cities. As an additional feature, I made an average of the blooming days during previous years for each city, assuming that the blooming day does not differ much from year to year.
Two Models, One Result
The image below is how the machine learning zone looks. There are two models, scoring one dataset for each. These two scored datasets are combined to create a single prediction result.

I made it this way because I set the target variable to “number of days until blossom.” This target variable itself takes a value between 0 and 365 (or even more). But I wanted to tell the model to look at this as a cyclical variable, so that it can correctly assess the error. For this, I scaled the variable to a range of 0 to 2π, then decomposed it into sine and cosine. Therefore, one model predicted the sine value, another predicted the cosine value. I combined the prediction results and reversed it to a day unit.
And which algorithms did I use? Of course, random forest. Why? Because its name fits with the theme. That's the only reason.
Results
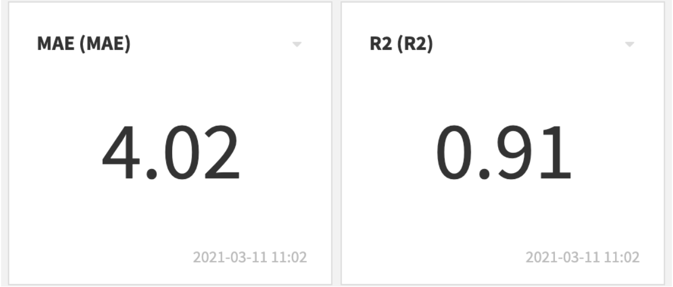
A random forest with 500 trees and the maximum depth of 100 yielded the best result. I was able to reduce the error to four days.
No Importance on Precipitation and Daylight Time
One interesting finding is that the model favored only the temperature-related features. All the other features, such as precipitation and daylight hour, had very little impact on the result.
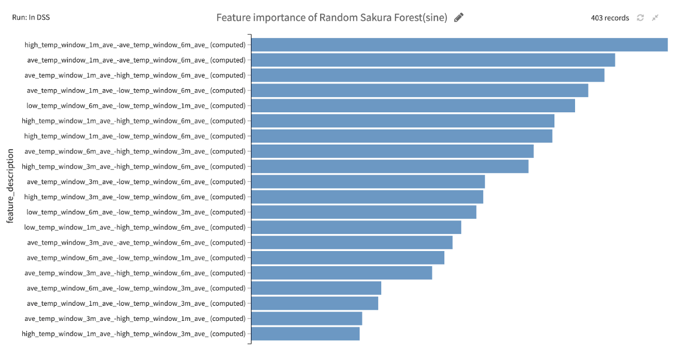
This made me wonder: Why did the model choose only the temperature-related features? I hadn’t been able to figure out the reason until I learned about one forecasting method used among Sakura researchers, which I'll expand on below.
Comparison With the Aono-Method
In Japan, forecasting the Sakura blooming day is the daily news headline throughout spring. But how do these forecasters make predictions? Since the 1950s, a lot of methodologies have been addressed, including multiple regression analysis. Nowadays, most of the Sakura blossom forecasters use a formula based on a method developed by Yasuyuki Aono, Associate Professor at Osaka Metropolitan University, in 2003.
Aono’s approach is unique in a way that it’s composed of two parts well-incorporating the biology of Sakura trees. First, it computes a D-day, where the trees wake up from their sleep during the winter time. This D-day is computed from a place’s latitude, distance from the sea shore, and average temperature during January and March, which therefore depends on the place.![]()

The second component is a value computed from a daily temperature using a formula proposed by Aono:

This value is added to the D-day and, when the accumulated value exceeds 23.8, we say that it’s the blossom day. By using future temperatures from weather forecasts, we can calculate the future values in the second component and therefore predict the blooming day.
What the Aono method tells us is that the blooming day depends solely on the place’s geographical position and its temperature, which is indeed consistent with my prediction result.
Of course, you can easily assume that both precipitation and daylight time affects the blooming day. But Random Sakura Forest neither favored precipitation nor daylight time because my data had a lot of temperature features, which are more directly relevant to the blooming day according to Aono’s formula.
Sakura Genes Are Not Random
If you have ever seen the Sakura blossoms in Japan, you might have noticed that all of the hundreds of trees in one place bloom simultaneously. As a Sakura lover it is fantastic, but… isn’t it strange? Are they talking to each other like, “C’mon guys, party time!”?
Genetic research has revealed that the species of Sakura trees you commonly see in Japanese parks, Someiyoshino, is a clone of a single tree that originated from a hybrid of the two different cherry species. Over generations, this single tree was multiplied by grafting, resulting in all the Someiyoshino cherry trees having the same genes.
Now it makes sense. That’s why they flower at the same time, which implies Sakura trees are not random. Given that, do you think a single decision tree would predict better? Well, it’s your turn to try that out in Dataiku! Also, check out this link if you would prefer to read the article in Japanese.


