Whatever your industry use case and goal, when it comes to predictive analytics, you have to deal with the geographical dimension. Those of us who have already tried know exactly how complex it can be to enrich models with new data based on geographical dimensions: searching and finding trustable data, checking quality, managing different files, merging, cleaning, and testing hundreds of tasks is what makes up a data scientist’s geographic nightmare.
Since we know that "geospatial" is often a major contributive feature of predictive models, we investigated in depth data catalogs that are able to provide hundreds of new potential attributes. The result is our first geospatial plugin based on Esri’s content.
In a few words, Esri is the creator of ArcGIS, one of the most powerful mapping softwares in the world. ArcGIS connects people with maps, data, and apps through geographic information systems (GIS), and it is used by Fortune 500 companies, national and local governments, public utilities, and tech start-ups around the world. You have no doubt already been exposed to some of their dynamic maps and apps in your professional and personal life.
In this blog post, we’ll describe the ways in which we can, using this new plugin, massively enrich our Dataiku datasets with new attributes based on geographic dimensions.
What is The Use Case?
Every year, the English Ministry of Education releases performance tables for all of the country’s schools . Our objective is to predict which of these schools will be more likely to score higher than the national average at the KS5 depending on different criteria (e.g. school type, student demographics, school age, school workforce, and finance).
In this demonstration, you will see how, in just a few clicks, you can enrich your data set with the schools’ postal addresses.
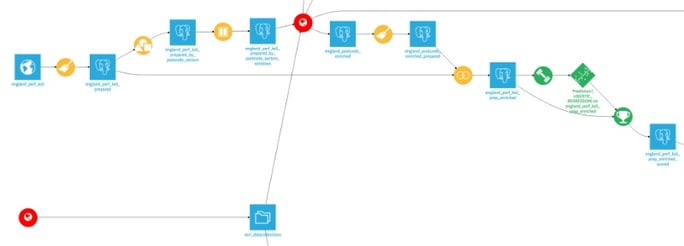
Data Upload
You can find the set of data we used right here.
The first step is to upload this data into Dataiku DSS; you should have one row for each school.
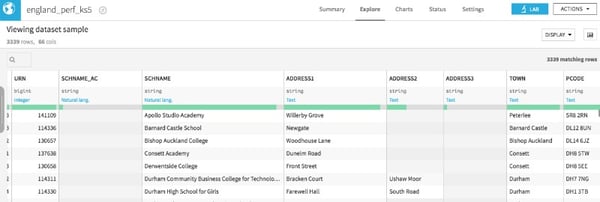
Data preparation
Preparing data for a data science project is often a long and complex process, but fortunately DSS offers a lot of powerful features for simplifying these tasks.
1. Create a preparation step:
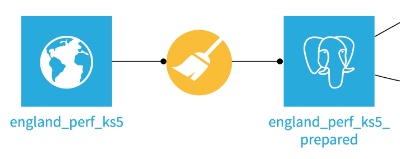
Some non-exhaustive steps:
- Clean the data: remove schools with no data and no identifier (URN), and create a column named target which will display 1 if the school score (TALLPPEALEVA) is higher than the global average (cleaned); otherwise, it will display 0. if (TALLPPEALEVA >= 209.47,1,0).
- Create a column named postcode_sectors by removing the last two characters from the field pcode. This will be the format required by the Esri ArcGIS Online API.
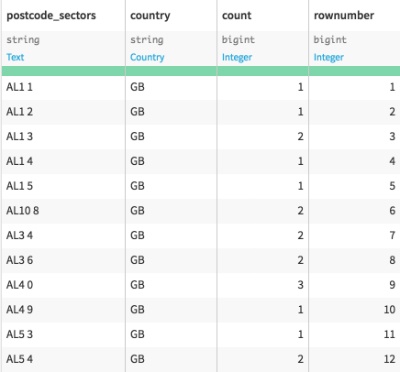
2. Create a unique set of postcode_sectors and a unique identifier (integer) for this postcode and add a column with the isocode2 country name "GB" (to be indicated to the API):
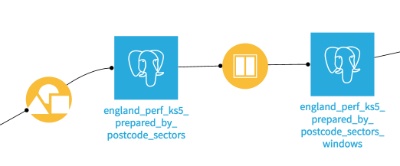
Results:
Now that all the preparation steps are done, we’ll set up the plugin.
Install the plugin:
In Dataiku DSS, go to the administration control panel (this requires you to have the admin rights), then Plugins > STORE.
Search for the Esri geo enrichment plugin and click install.
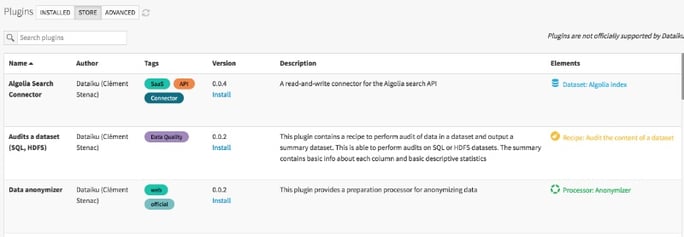
You can find out more information about how to deploy the plugin here.
Now you should see a new plugin called Esri geo enrichment with new recipes and a custom dataset.
Accessing the Esri Geo Enrichment Service
The Esri geo enrichment plugin works with an ArcGIS Online user login / password.

If you are not already an Esri customer, you can open an account here or ask your favorite Esri sales representative... please kindly mention that you are coming from Dataiku. :)
Get the Esri data collections:
In order to request the right data from the ESRI API, we need to firstly get the available data collections.
Here is what we need to get:

Some definitions:
- Layer_id = the layer name we need to pass to the API if we want to enrich a statistical named area like the postcode. For instance, this means that every country has a different format for their postcode; this value will have a different format from one country to another
- Collection_id = each collection has a specific name and can contain hundreds of fields. By default, the plugin gives you the ability to pick up the Facts and the Spends (>100 columns) which is a very good starting point. If you need more specific collections, you’ll be able to put the name you want into the related recipe UI.
1. Select the custom recipe named "Utils – Get catalog content for countries". Here, we are only interested in "GB"
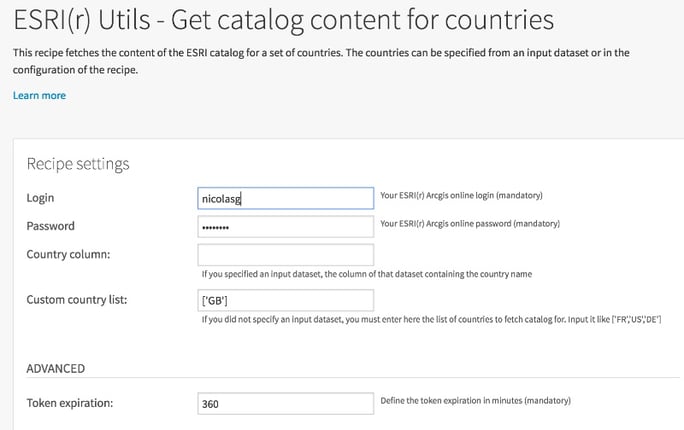
NB: If we have multiple countries, we could either add an input dataset with a column of countries or add values to the country list. NB: For the right country format, you can refer to the custom dataset provided with the plugin "Utils – Show Enrichment API Coverage".
Set the "Enrich from statistical named area" Recipe:
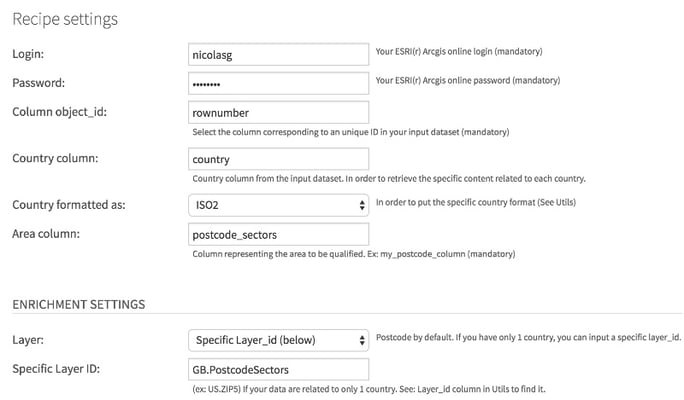
Here are the inputs and outputs:
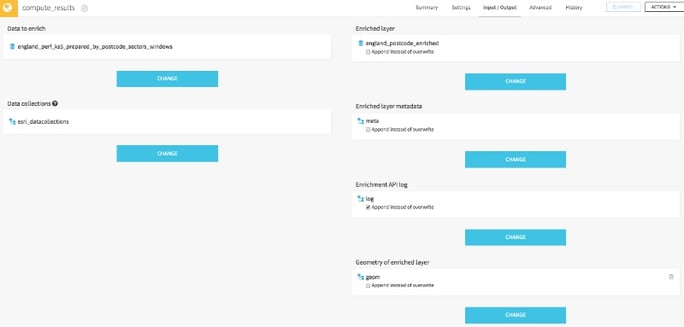
The corresponding specific layer ID to be enriched is named "GB.PostcodeSectors" and we want to firstly test if the Facts and Spends could bring value to our predictive model. Our column to be enriched is "postcode_sectors" from the country "GB" (stored into our input dataset).
Run the recipe:

Apply a preparation recipe to your dataset:
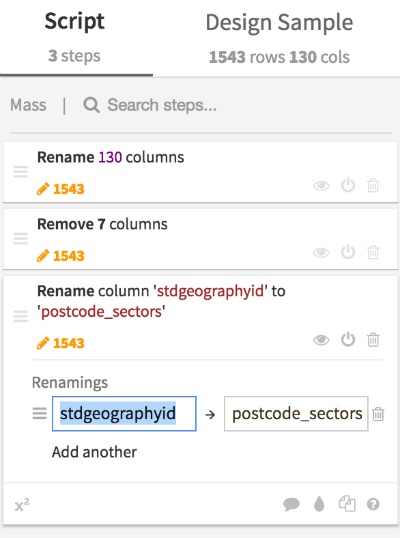
- Lower all your fields and rename the stdgeographyid by poscode_sectors
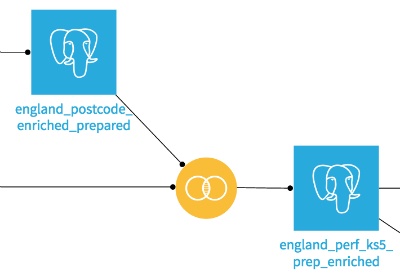
Join this dataset with the one prepared at the beginning and… you now have 153 columns.
Create Your Predictive Model
Click your enriched dataset and select "Lab":

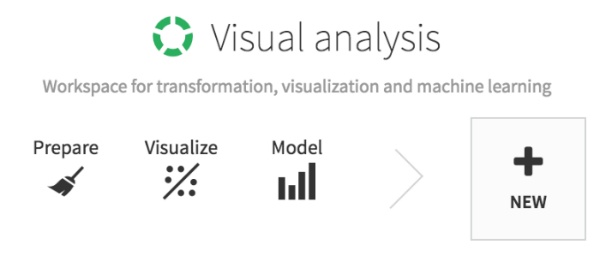
Then create a new visual analysis:
Analyze your datasets with some charts and then create a model (predict target):

Run different algorithms to compare the results (in this case we only run a logistic regression in order to get the coefficient for all factors).

We have two of the predictive variables coming from the enrichment of the top 20 most important variables:
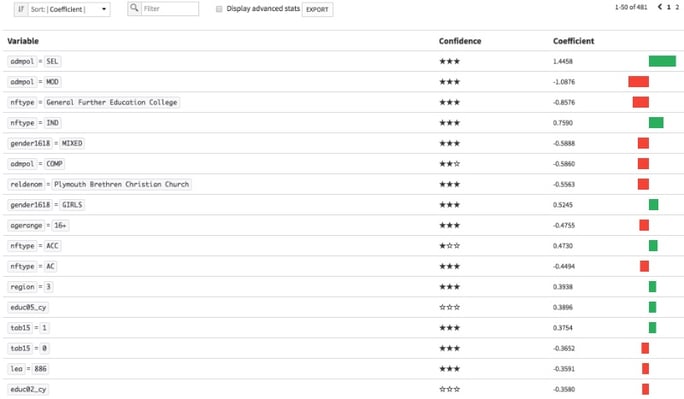
We need to find more information on the educ05cy and educ02cy. Take the metadata dataset:

Now imagine, if you remove these two columns from the dataset (in the same training sample).

- There is an impact on the AUC. Then you see that this enrichment is bringing value.
Conclusion
You have seen that you can enrich your dataset with hundreds of new columns in just a few steps. We also encourage you to check the enrichment from XY coordinates.
Dataiku is an Esri silver partner and is a certified partner with the biggest software publishers.


