


For companies in fields like manufacturing and logistics, predictive maintenance is one of the most compelling use cases of machine learning. Just imagine: as every day passes (and as you accumulate more data to add to your model), you get better and better at identifying which part, machine, truck, etc., is likely to break down first. You reduce downtime and allocate resources like repair people more efficiently.

In our gallery of sample projects, we present an example of a car rental company that is struggling with increasing technical issues. For this company, the cost of these issues goes beyond downtime, because they impact the customer experience and pose significant risk of negative brand impact. Fortunately, they’ve turned to machine learning and predictive analytics to solve their problems.
From Raw Data to Features to a Model
We are given three datasets, each with between two and five fields, as our raw data. At first glance, it doesn’t look like we’ll have many features for our model, but once we join the datasets, we’re able to create a slew of new features.
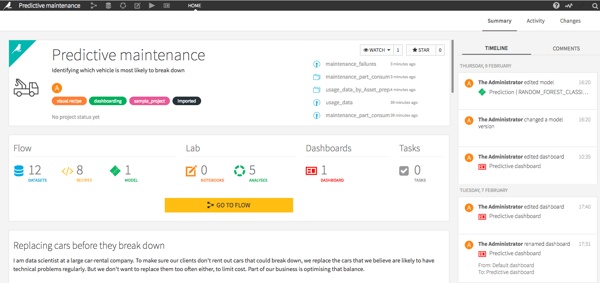
Our project page shows us all of our datasets, models, dashboards, and more.
Take a look at the usage_data_by_Asset_prepared dataset, and you’ll see that we’ve taken the initial raw dataset with just three fields and, by grouping on “asset” (which is the field with individual cars), we’ve created some useful features such as the when the car was first rented out, how many kilometers it had on its odometer when it started, and how many kilometers it’s driven since then.
From the raw maintenance data, we’ve once again grouped by individual cars, and this time we’ve pulled out each maintenance code as its own variable, so now we have the number of times each car has been serviced for each specific issue. Now we can join these two datasets with the maintenance_failures dataset (which simply tells you if a car has broken down), and we’re ready to run our model.
Making a Model Actionable to Your Team
The model we use is a random forest model, and our analysis of our model provides a little bit of an interpretation of the model: the six most important values include the number of kilometers the car has driven as part of our company, the number of kilometers it had when it started, the time it has been with the company, and the frequency of three specific maintenance issues. Knowing the drivers of this model is interesting, but is it actionable? If the audience for this analysis is a manager or a mechanic, probably not.
The key to making the model actionable to your team is in making a report that doesn’t sum up the past but predicts the future. In this case, we have a dashboard that shows the percentage of cars that are at risk of failing (over 30% — that should get the manager’s attention!), as well as two lists: first, the cars that are at a high risk of failing; and second, cars that are at a moderate risk of failing.
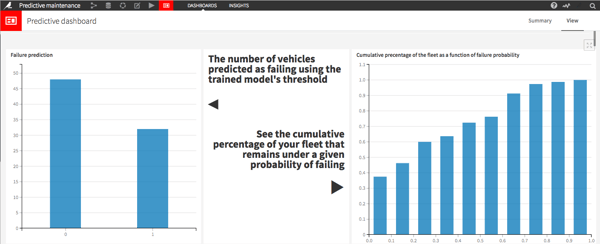
A screenshot of the top part of the dashboard. Click the image to see the whole thing.
The number of cars in the first list is only six, but you can imagine that whoever looks at this report will know exactly what his or her next actions should be in order to fix these cars before they break down. Check out the whole project in a real, live, and functioning example of Dataiku DSS right here.