


Crime is an issue that is present everywhere; it’s in every city and in every country in the world. Preventing, intervening in, and rectifying harm done by crime costs $10 billion annually in the U.S. alone.
This blog post is adapted from our data science publication Data From the Trenches. DFTT is a place for our data scientists to share their more advanced projects with code snippets and generally more technical stuff. Go ahead and explore the more advanced version of this blog post to learn all about how to implement kriging and Facebook's Prophet model.
Over the years, there have been many attempts to predict crime, of course. But we’re still not very good at knowing how to intervene and where it will happen next. There are more than 200,000 scholarly articles on the underlying causes of crime, and past studies connect crime to poverty, education levels, and many other parameters that we can’t actually actively change.
In September 2016, the National Institute of Justice (NIJ) launched the Real-Time Crime Forecasting Challenge to predict crime hotspots in the city of Portland, Ore. and kick start innovation around the topic of crime prediction. In this blogpost, I will talk through our approach to this challenge where we used a combination of machine learning, time series modeling, and geo-statistics.
The team here at Dataiku actually made a submission to the challenge and won in a few categories, predicting auto theft with a higher accuracy than others.
The Gist
For this project, we started by observing that one of the key characteristics of crime data is that it has both a geographic dimension and a temporal dimension (crimes happen in different places at different times). It can also be affected by many different types of features — weather, city infrastructure, population demographics, public events, government policy etc.
So we started with the data released by the NIJ and enriched this data with a variety of public data sets including police reports, U.S. census data, data from the Foursquare application, data from newspapers, and the weather.
The Challenge: Why Predict Crime
Recently, preventative policing has become a topic of interest -- can we predict, and therefore prevent, crime before it occurs?
To be clear, the goal of projects like the NIJ challenge is not to strike crime before it happens à-la Minority Report, or to increase community stigma. The goal is to provide actionable techniques for policy makers and police officers to anticipate crime.

The goal of crime prediction projects is not to strike crime before it happens à la Minority Report.
Indeed, past research on preventive policing suggests that randomly increasing police presence isn't as effective in reducing crime rate as targeting crime hotspots, or areas with a high likelihood of future crime occurring.1, 2 Moreover, evidence suggests that these hotspot interventions are not merely displacing the crime to nearby areas, but actually decreasing the overall crime and incarceration rates in the larger area.3,4
Also, understanding what features drive crime in an area is an interesting tool to support police efforts with certain policies to change those factors.
Finding Hotspots: Crime as a Technical Challenge
So, how does one actually find these crime hotspots?
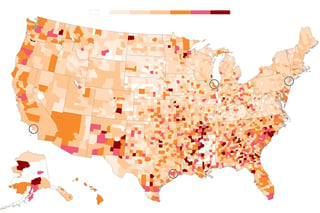
Source: The Washington Post
Looking at a map of the U.S., we can see that there is clearly a spatial structure to criminal events, but the temporal dimension is harder to visualize. Obviously, not every point in time and space is equally likely to host a crime. But it can be very hard to leverage both of these structures to accurately predict future crime, and it can be especially hard to understand the underlying factors that are driving these crimes.
There have already been many different approaches employed to attempt to predict crime, including interviews with convicted criminals and analyses of large-scale social media data. Work in criminology and sociology has laid much of the foundation for these types of analyses, from figuring out how to define a hotspot to measuring the effects of police intervention in these areas to coming up with targeted hypotheses of features that drive crime.
However, traditional crime prediction approaches like these face challenges like:
- Relatively small datasets
- Looking at temporal or spatial data, but not both
- A small number of features used to explain crime
These challenges are exactly what big data approaches are designed to overcome. And, in fact, there are some really cool projects that have come out of AI and machine learning (ML) approaches to crime.
However, these projects also have their own limitations. Because they are relatively new approaches, they lack targeted analysis techniques (even though the data that goes into thinking about crime is complex and requires more specific techniques). Also, these projects often treat the spatial or the temporal aspect, but not both simultaneously.
So with all of that in mind, the goal of our project was to:
- Use only open source data.
- Engineer spatial and temporal features, and take advantage of the dependencies in these types of data.
- Use targeted statistical techniques to handle these specific types of data.
- Model and predict crime.
- Understand those predictions and generate features for further testing and exploration.
What Are We Predicting?
The data released by the NIJ was the basis for the project, as that is the data that needs to be predicted. It’s a dataset of all the 911 calls that have led to police interventions for street crimes, burglary, and motor vehicle theft between March 2012 and March 2017. This is what we use as a target to predict a crime.

The project uses a dataset of all the 911 calls leading police interventions for street crimes, burglary, and motor vehicle theft.
This data comes in the form of a geo-point, a time and date, and the features of the call. When trying to figure out where crime might occur, it's important to consider both geographic features (what makes one neighborhood different from another?) and temporal features (what makes one point in time different from another?).
What Can We Use to Predict Crime?
![]() .
.  .
. 
OpenStreetMap
The first data we brought in was points of interest from OpenStreetMap. Along with roads and geographic features, OSM marks points of interest (POIs). Features that occupy a particular point that are tagged with user-generated information, including category tags such as Amenity, Hotel, Shop, Restaurant, Mailbox, etc. We extracted these geo-points and tags.
Foursquare
More than just points of interest, we wanted to look into how people actually use different neighborhoods in Portland. To get a sense of how people spend their time in each neighborhood, we pulled data from the Foursquare API and extracted checkins in restaurants and other businesses.
Police Precincts
Next, we grabbed the map of police precincts in Portland, which came in the shape of a tiling of the city showing what bit of land belongs to what precinct.
U.S. Census Data
The U.S. Census collects over 20,000 features on each neighborhood in the United States (between 600-3,000 people per precinct) including the number of people, gender, average income, number of cars per household, etc. To choose from among these 20,000+ features, we only extracted the features that correlated with our target (911 calls) over the years that we had (2014, 2015, 2016). This data is both geographical (its tiles) and historical since we can observe the variations over the year.
Weather Data
To explore the temporal aspect of crime, we extracted weather from the NOAA weather API. This gave us pretty much everything we wanted to know about the weather (temperature, precipitation, wind, etc).
Holidays and Events
The goal here was to clean up the noise in the data linked to the day of the week or events (do people commit less crimes around Christmas? More crimes?). That's how we got our data for the challenge, best of luck if you try the challenge on your own!
1Braga, Anthony Allan, and David Weisburd. Policing problem places: Crime hot spots and effective prevention. Oxford University Press on Demand, 2010.
2Sherman, Lawrence W., and John E. Eck. "Policing for crime prevention." Evidence-based crime prevention 295, 2002.
3Telep, C. W. and Weisburd, D. 2015. Hot Spots Policing. The Encyclopedia of Crime and Punishment. 1–3.
4Bratton, 2011 Bratton, W. J. (2011). Reducing crime through prevention not incarceration. Criminology & Public Policy, 10, 63-68.