


So, before we jump into markdown optimization and why it’s important for retailers, let’s discuss traveling (bear with us, we have a point). If your friend wants to visit Thailand for 10 days, she would probably be faced with some difficulty figuring out where exactly to stay, as evidenced by the myriad of options below. Once she decides that, how will she spend her time? Going to beaches, meeting new people, hiking, meeting up with family, doing food tours, visiting templates — the list goes on!

Just like your friend figuring out how to pass the time on vacation, retailers are racing against the clock trying to meet constantly evolving customer needs under a variety of constraints. Ultimately, your friend needs to decide between maximizing the number of locations visited or the amount of time spent at each location. When visiting as many places as possible, the downside is it’s less memorable as she isn’t getting immersed into the culture, whereas the downside to taking time to absorb the people and culture is she will always inevitably miss a place and will have to make a trip back.
How can she find the right combination between the two options? By striking the balance between maximizing the quantity of cities visited and quality time spent at each place, she can maximize her overall happiness under constraints. Her happiness can be based on different KPIs such as delicious food, awesome nightlife, and beautiful beaches — with the constraints of limited time, budget, or friends to visit, for example.
Similarly, with pricing, markdown optimization will determine the best discount for each product. It involves finding the right balance between a high discount for maximum quantity sold versus a low discount for a high unit margin by exploring all the discount scenarios in order to maximize the company’s KPIs under constraints. It’s important to note that the company’s KPIs could change depending on the context. During the end of season sales, we usually care more about minimizing stock loss while, for other periods, it’s usually about maximizing margin. When the company wants to increase its market share, the goal could be to maximize revenue, for example.
At its most basic level, markdown optimization does exactly what it sounds like — strategically reduces a product’s sell price (including best timing and extent of markdown) by taking factors such as a product’s historical sales, characteristics, price range and discount, competitors’ pricing, store characteristics, and seasonality trends into consideration. In order to take into account the effects of the global health crisis, we also use the economic index from the French National Statistics Institute — one of the most important features of the analysis.
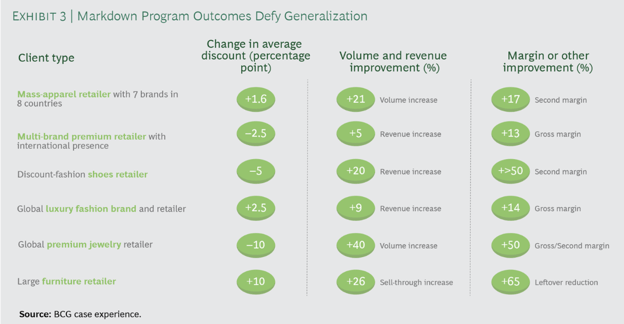
Ultimately, the goal is to improve the company's KPIs at the moment (maximize margin, minimize stock loss, win market share, or a combination of them all). At Dataiku, we’ve seen great success with markdown optimization — we predict success for one of our global retailers at a 17% uplift in margin and a 22% increase in revenue, compared to a non-AI method. But don’t take our word for it — the stats below from BCG speak for themselves:
Our PRICE Approach
To build a markdown optimization project, we developed our own approach: the PRICE approach. It is founded on five core pillars: Predict - Recommend - Illustrate - Collaborate - Evaluate.
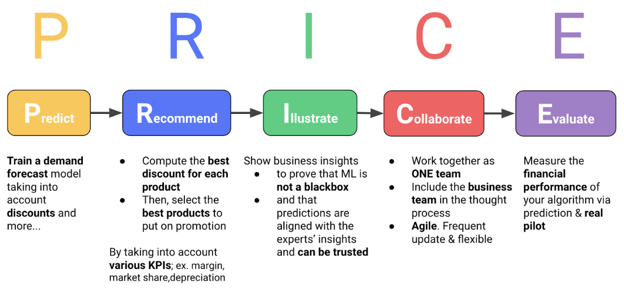 So, how is markdown optimization done in practice? To begin, the “P” in PRICE stands for Predict — you can start by training a demand forecast model on historical weekly sales by SKU, ensuring that it takes discounts into account. The goal is to forecast the weekly volume (quantity) that you can sell for each SKU at each store and each discount possibility. We do not recommend that you predict the daily volume. The weekly volume is easier to predict accurately and changing prices everyday might not be necessary.
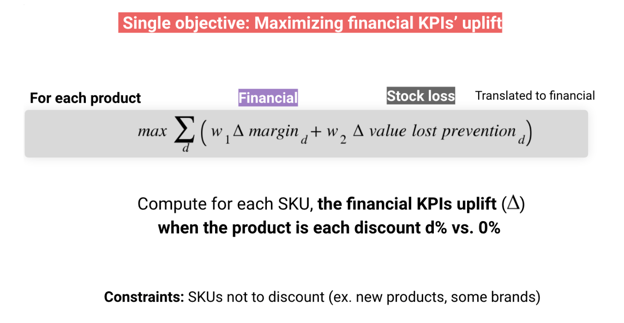
Next, the “R” in PRICE stands for Recommendation — compute the best discount for each product and select the best products to put on promotion by taking various KPIs into account (i.e., margin, market share, and stock loss). In a simplified way, this step consists of predicting the forecasted margin uplift (if the KPI to maximize is the margin) for each discount possibility for each SKU and determining the discount that generates the maximum margin uplift. With a tool like Dataiku, you can also easily take into account your business and legal constraints (i.e., remove the discount possibilities that do not verify the constraints, such as where you sell at a loss).
 However, the numbers from the algorithm are not enough to determine the best discount for each product. You also need to convince the decision makers (the business side of the house, such as pricing, marketing, or e-commerce teams) to use the algorithm’s recommendations. That’s where the “I” in PRICE comes in — Insights need to be shared to prove that machine learning is not a black box and that the predictions are aligned with the experts’ insights and can in fact be trusted. This can be done by illustrating the elasticity curve by product family, product traits, or target group, for example. We also recommend that you illustrate the financial uplift generated as a result of the algorithm.
Next, in order to build the project in an optimal way, teams need to work together toward a common goal. By including the business team in the thought process, you will be more poised to collaborate (the “C” in PRICE stands for Collaboration) and iterate in a way that delivers results faster. Finally, it’s time to move toward measuring results. The “E” in PRICE stands for Evaluate — analyze and measure the financial performance of your algorithm via prediction and a real pilot. Don’t forget that the algorithm’s accuracy isn’t everything. While, yes, it’s important because it can ensure that we believe in its proposition, what’s more important is the financial uplift that the use case will create for the company. The demand forecast algorithm with an error of 40% MAPE (mean average percentage error) might already generate a margin uplift of 5% while trying to reduce the error to 30% might not provide much incremental value.
Here's Some Practical Advice to Succeed With Markdown Optimization
1. Don’t fall in the trap of building a perfect demand forecast model with hundreds of features at first.
Instead, start with the essential features first. Discussing with the business team before building the first model will save you time and energy as they will always have instincts on what matters on the sell volume, so you should iterate with them frequently. Build a simple model for the “P” part and then go up through the end of the “R” part to have first discount recommendations to iterate with the business team. The business team could then see if the algorithm’s recommendation is logical and, if it’s not, could use their business insights to suggest how to improve the model, which features to add, etc.
2. Don’t take business team requests and constraints as must do, but keep them in the loop.
It will be tremendously difficult to instantly incorporate all of their requests and constraints, but do your best to negotiate and dig in to see if some constraints are critical or some requests aren’t important for the model. For example, we know that the lower the amount of time we have to forecast, the higher the accuracy. If the business team says we must get the discount proposition two weeks in advance, we might be able to dig in if it is really two weeks or if one week is actually enough. After all, data science teams are like analytics doctors — we listen to the patients but have to dig into the symptoms before just prescribing medicine that the patients may ask for.
3. Don’t forget to forecast the financial/business KPI uplift from the algorithm.
Be sure to use a dashboard to forecast and illustrate findings, such as how much margin, revenue, and volume the algorithm adds compared to the legacy method (which is typically without AI-embedded technology or, in some cases, manual). It’s much more powerful to say that, thanks to this algorithm, we will generate X millions more per week rather than our demand forecast model has a 30% MAPE.
Building Markdown Optimization With Dataiku: How Much Faster Is It Compared to Full Python Code?
Four times faster (with our experience building pricing optimization for past customers with Python, before joining Dataiku)! We had six full time data scientists writing thousands of lines of code, each in numerous pages in PyCharm, for six months. It was totally painful. With Dataiku, we were able to do the same using only the time of 1.5 data scientists. The project was built mainly with available visual recipes in Dataiku; both for data preparation and machine learning. Less than 200 lines of Python code were needed in all!
This means you don’t even have to know how to code to make the markdown optimization happen! So what are you waiting for?