


In the landscape of imbalanced classification, the limitations of traditional oversampling approaches have become increasingly evident. In this article, we delve into an intriguing question: What can generative models bring to the table?
We’ll take you through our exploration of tabular data augmentation (TDA) methods based on generative models for tackling the challenges of imbalanced tabular datasets. We will see that generative models (including LLMs!) are very good at synthesizing realistic tabular samples, but augmenting training sets with this data rarely boosts predictive performance.

As an ML practitioner, imbalanced datasets can be a thorn in your side. During training, the model focuses on the majority class (hence yielding poor performance on the minority class), classifying most minority samples as part of the majority class. This becomes especially crucial when misclassifying the minority class carries higher costs than misclassifying the majority class.
Generative models can be used to tackle this issue by enriching the dataset with synthetic samples from the minority class. These synthetic samples closely resemble real ones but aren’t identical, enhancing class diversity. However, scientific literature in the field lacks an evaluation of generative methods on imbalanced tabular datasets. Existing works either don’t focus on imbalanced classification tasks or exclusively employ traditional, non-generative models that are now openly criticized.
We’re diving deep into generative models, benchmarking the best methods to compensate for class imbalance, and revealing the complex realities of tabular synthesizers.
Benchmarking Synthesizers for Imbalanced Learning
In this benchmark, we compare state-of-the-art tabular synthesizers to traditional methods for the imbalanced classification task.
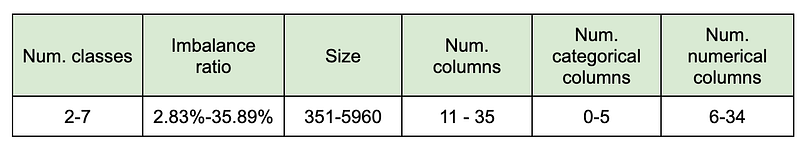
We selected six tabular datasets (HMEQ, thomas, popularkids, eucalyptus, steel_plates_fault, and ionosphere), from small to medium size, including both categorical and numerical features. These datasets naturally exhibit different imbalanced class distributions, ranging from highly imbalanced to almost no imbalance, in both binary and multi-class scenarios.
Our reference model is the XGBoost classifier with default hyperparameters [1]. We assess the classifier’s performance using F1 and AUC. We compute macro F1-score and macro AUC in imbalanced multiclass datasets to provide a balanced evaluation across all classes.
When you visualize performance metrics on imbalanced datasets, you may notice overfitting, particularly pronounced for minority classes (figure below). Generative models might alleviate this issue by creating synthetic data points that resemble existing data, helping to bridge performance gaps.

We use several baselines:
- DataIdentity: Use the original dataset as is, without augmentation.
- DataIdentity with balanced weights: The classifier weights are inversely proportional to the class frequency to give more importance to the minority classes.
- DataIdentity with custom weights: Increasing values (such as 1, 5, 10, 15, etc.) are assigned as weights from the most to the least represented class. This is a smoothed version of the previous weighting scheme adopted in cost-sensitive learning.
- SMOTE (Synthetic Minority Over-sampling Technique) is a popular method that generates new synthetic data points by interpolating between existing class samples [2]. This traditional technique is now openly criticized as research finds that hyperparameter tuning (and post-training threshold tuning in binary tasks) yields similar results as SMOTE sampling.
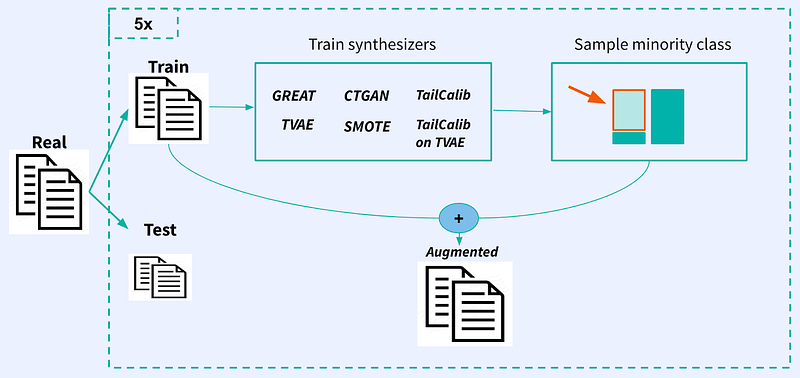
We train all synthesizers on the dataset training set. Subsequently, we generate additional synthetic samples, exploring two augmentation strategies:
- Augmenting the minority class only until we have a balanced dataset: This strategy is common in few-shot classification [6].
- Augmenting all classes by a fixed rate: This approach is commonly used to reduce overfitting in data augmentation for computer vision [7][8].
To ensure robustness, we run the benchmark five times, allowing for a comprehensive assessment of the performance and consistency of the methods.
After augmentation, we fit the classifier on this augmented dataset and score the unchanged test set with performance metrics.
Additionally, we calculate quality metrics to assess the divergence of the synthetic data from the original data.
Unlike synthesized images, where we can assess the quality at a glance, evaluating tabular data quality for synthetic samples is challenging (unless having a data expert always on hand). We use several metrics from the Synthetic Data Gym (SDGym) [3] benchmarking framework:
- Synthesis measures how many synthetic rows match real ones.
- Coverage checks if synthetic columns cover the real data’s value range.
- Boundary ensures synthetic columns respect real data’s min and max values.
- StatisticSimilarity compares summary statistics of original and generated columns.
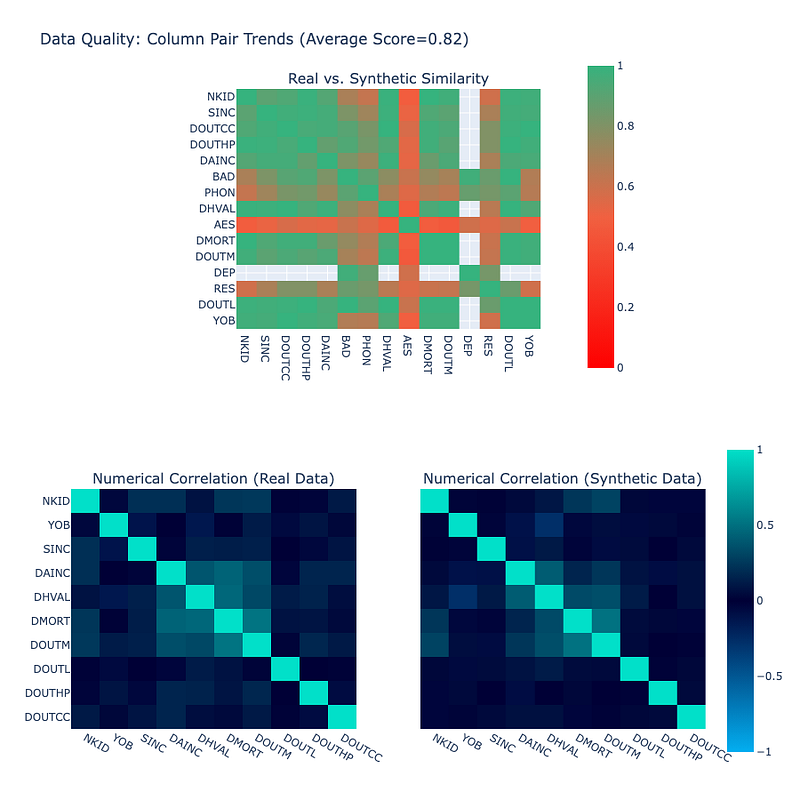
- Overall Quality is an aggregation of Column Shapes that describe overall column distribution change (based on KS statistic) and Column Pair Trends that describe how column pairs vary in relation to each other (figure below).
Synthesizers
Here is a brief overview of the synthesizers we play with:
- CTGAN: The Conditional Tabular Generative Adversarial Network is a state-of-the-art generative model that is designed specifically for tabular data [4]. It consists of a generative adversarial network (GAN) conditioned on the class. CTGAN efficiently manages diverse data types: Discrete values are one-hot encoded, and continuous values undergo mode-specific normalization with additional one-hot vectors, representing the mode each value belongs. As the CTGAN is trained with class conditioning, it is possible to explicitly specify the desired class to be generated.
- TVAE: The Tabular Variational Autoencoder is another type of generative model for tabular data introduced in the same paper [4]. It consists of a VAE that employs the same preprocessing designed for tabular data as in CTGAN.
- GReaT: Generation of Realistic Tabular Data. GReaT is a model that uses an auto-regressive generative LLM (GPT, for example) to sample realistic tabular data [5]. The main idea is to represent a table row as a textual sentence and then fine-tune an LLM on correctly completing this sequence. GReaT allows arbitrary conditioning on feature subsets without model retraining, thus the sampling can be performed by conditioning on any combination of feature names and values, including specifying the class value and requiring class-specific generation.
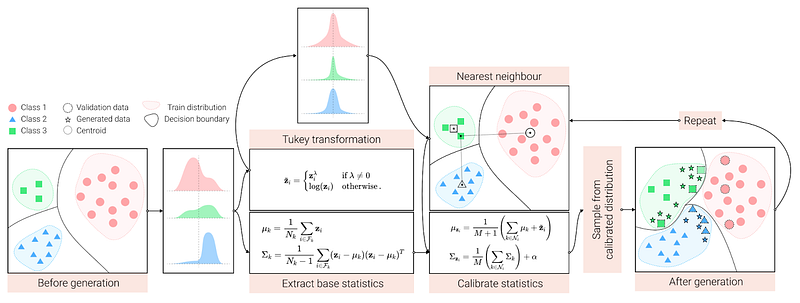
- TailCalib: Tail calibration has been designed to address the issue of long-tailed distributions (under-represented groups) [6]. The underlying idea is to tweak the class distributions with information that comes from neighboring classes, a process called calibration. For each instance of a class we want to augment, TailCalib selects neighbor classes as those with the class mean closest to the instance, using the L2 distance. The method computes a calibrated distribution for each instance by shifting its mean towards the mean of the neighbor classes and setting the covariance as the average covariance of the neighbor classes. Each instance-specific distribution is then used to sample new data of the same class until balancing the dataset.
- TailCalib on TVAE: For tabular datasets, we can use a TVAE to create a more compact representation of samples. Afterward, we apply tail calibration within this TVAE latent space. In addition, TVAE encoder-decoder architecture allows us to decode the generated embeddings back to the input space. This backward step is necessary as the quality metrics are computed in the input space.
Baselines Are Hard to Beat
From our benchmark augmenting the minority class, there is no clear synthesizer that consistently outperforms all others across all six datasets. In general, most synthesizers exhibit performance comparable to the baseline models or only slightly better (figure below).
However, note that the performance of the synthesizers can be dataset-dependent.

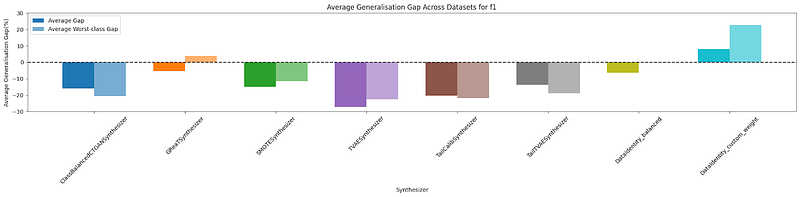
We examined the generalization gap ((F1train_baseline-F1test_baseline)-(F1train-F1test))/(F1train_baseline-F1test_baseline) relative to the DataIdentity baseline (no data augmentation, y=0) and observed that DataIdentity with custom weights and GReaT were able to mitigate overfitting when employing minority class augmentation (plot below).
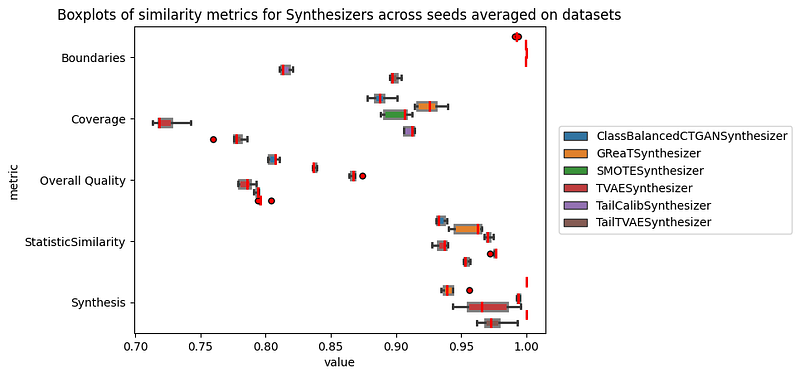
Most synthesizers exhibit high quality properties. In particular, the synthesis metric indicates that the generated samples are predominantly novel and distinct from the original data. This suggests that the synthesizers are effective in generating synthetic data that possesses a high degree of variability and diversity.
Furthermore, the box plot below reveals that the synthetic data produced by the synthesizers maintains a notable degree of similarity to the real data. However, without a clear calibration or reference point, interpreting the significance of these scores is challenging.
Better Quality Doesn’t Yield Better Performance
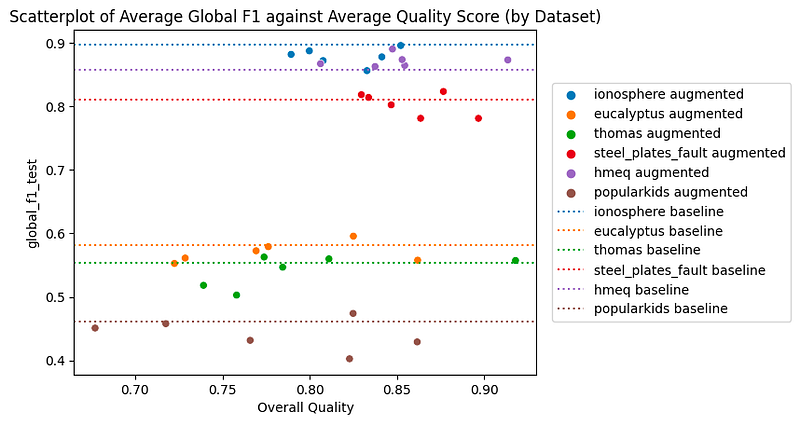
Despite good quality metrics, state-of-the-art tabular synthesizers are not able to outperform the baselines in most cases. But then, how is generation quality related to predictive performance?
In the figure below, each dot represents a different synthesizer, while each color clusters a different dataset. This analysis shows that better data quality doesn’t always mean better results (no positive trend within the same dataset/color). Instead, the complexity of the classification task is a pivotal factor: The harder the task, the harder synthesizing high quality samples is (positive trend overall).
Augmenting Minority or All Classes?
Augmenting the minority class doesn’t seem to be an effective approach for imbalance learning: Can we do any better augmenting all classes, instead?
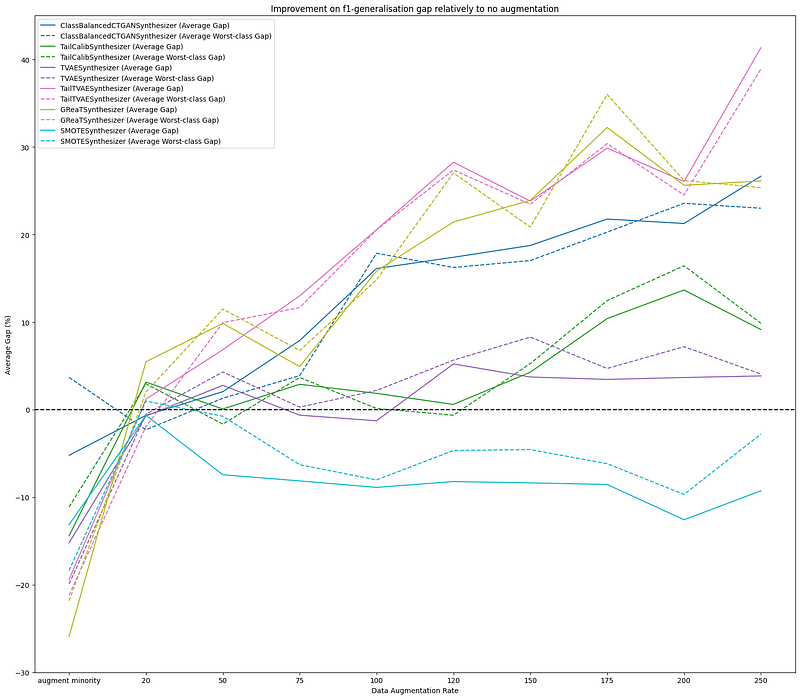
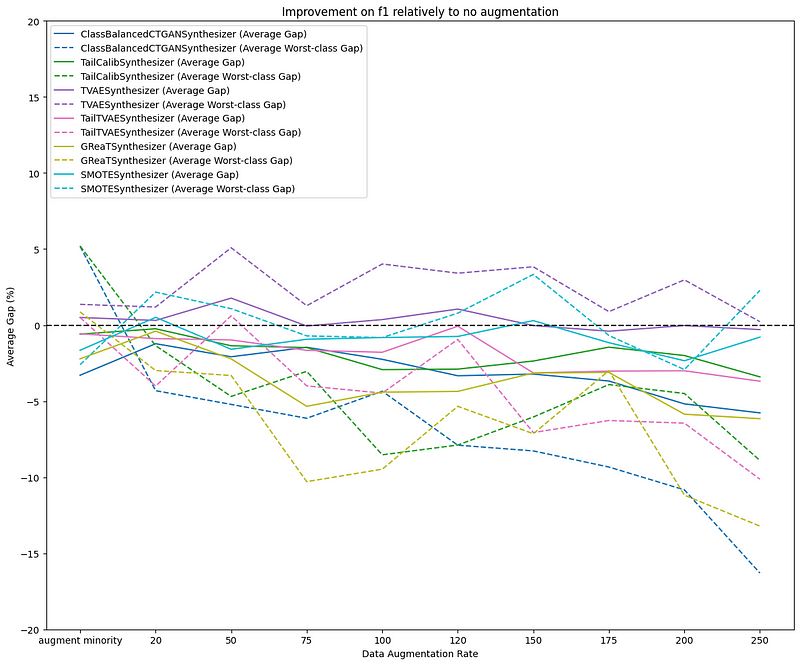
The plots below compare augmenting minority classes until all classes are balanced (first tick on the x-axis) versus augmenting the entire datasets with an increasing rate. The first figure shows how the F1 generalization gap improves with respect to the DataIdentity baseline (y=0), while the second figure shows how the F1 score improves relatively to the same baseline.
The metrics are computed for all classes (solid line) and for the worst class (dotted line) and are averaged across datasets. We observe that augmenting the dataset by a specific percentage does contribute to reducing the generalization gap (first figure), while slightly decreasing the performance too (second figure). The best tradeoff between generalization and performance is obtained with small augmentation rates.
In this setting, the TVAE synthesizer has some gain over the baseline, while the other synthesizers still show no improvement. Still, there is significant variation in results across datasets, suggesting again that the dataset’s complexity highly impacts synthesizer performance.
Managing the trade-off between improvement on the generalization gap and performance highlights the challenge of addressing dataset imbalance and the need for careful sampling strategy selection. In some cases, narrowing the generalization gap may require accepting a slight overall model performance decrease. In such scenarios, understanding the trade-offs of different sampling strategies is essential for making informed decisions in machine learning applications.
Conclusions
Modern generative models can synthesize realistic samples for tabular data, offering a way to compensate for imbalance classes. But when it comes to final classification performances, data augmentation seldom surpasses simple class weights, regardless of the synthesizer used.
The harder the task, the more difficult it is to synthesize high-quality samples, and, while some models generate more faithful samples than others, better data quality doesn’t always translate to improved classification results. Still, tabular data augmentation—especially targeting all classes and not only the minority class—effectively reduces overfitting.
References
- L. Grinsztajn, E. Oyallon, and G. Varoquaux. “Why do tree-based models still outperform deep learning on typical tabular data?”
- Chawla, Nitesh V., et al. “SMOTE: synthetic minority over-sampling technique.”
- “SDMetrics.” Online: https://docs.sdv.dev/sdmetrics/
- Xu, Lei, et al. “Modeling tabular data using conditional gan.”
- Borisov, Vadim, et al. “Language models are realistic tabular data generators.”
- Vigneswaran, Rahul, et al. “Feature generation for long-tail classification.”
- Simard, Patrice Y., David Steinkraus, and John C. Platt. “Best practices for convolutional neural networks applied to visual document analysis.”
- Krizhevsky, Alex, Ilya Sutskever, and Geoffrey E. Hinton. “Imagenet classification with deep convolutional neural networks.”