


You don’t need us to tell you that the data world – and everything it touches, which is, like, everything – is changing rapidly. These trends are driving the opportunities that will fuel your career adventure over these next few years.

At the heart of these trends is a massive wave of data being generated and collected by organizations worldwide. With this data we can shift our focus as analysts from explaining the past to predicting the future. And in order to do this, we need to spend less time doing the same things over and over and more time doing brand new things. And accomplishing all these changes will require us to work together differently than we do now.
Trend 1: Bigger Faster Data
You’ve probably already heard the fact that every two years we, as humans, are doubling the amount of data in the world.

Big data continues to get even bigger - every two years, we double the amount of data in the world.
This literally exponential growth of data is impacting analysis in some big ways:
- Big data means new infrastructure: distributed computing like Hadoop.
- Large datasets mean new tools. Excel can no longer do the work it once did. We’ve seen analysts using Access to cut datasets down into Excel-digestible pieces. Note: this is not a sustainable strategy! If you haven’t already, expect to start working with some new tools very soon.
- We are on the cusp of the real-time data revolution. Services like Kafka will enable organizations to apply their data products in real time, which will revolutionize everything from operations to customer service. The urgency of top-notch analytics will be paramount!
Trend 2: Predictive Analytics
The vast majority of time spent by the vast majority of today’s analysts is on understanding data collected in the past, often in the form of reports and dashboards. Those days are coming to an end. The data and tools now available are allowing analysts to go beyond just convincing someone to do something and instead to often just do it themselves. For example:
- Using customer data to identify which customers are most likely to churn (stop being subscribers/customers) – offer them special deals automatically in order to keep them.
- Using Internet of Things (IoT) data to identify which machines in a factory are most likely to break down, and fix them before they cause a disruption to production. This is called "predictive maintenance," and not only does it reduce downtime, it can also substantially lower insurance rates.
- Using customer behavior data to narrow down potential fraud cases for insurance companies. As the predictive model gathers more data, it becomes even better at figuring out which cases the company should focus their investigative resources on.
Trend 3: Automation of Tasks
Once upon a time, analysts built a model in Excel, and once a month or so, they exported the model to PowerPoint and send it to (or even printed it out for) the managers who relied on regular reports. Soon, there were too many reports, so maybe they used macros in Excel to automate the creation of reports. Or maybe they were lucky enough to have a dashboard program that had some automation functionalities built in. The future promises even more than this:
- Replicable data preparation flows/recipes that can be applied and customized easily and quickly to brand new sources of data and for brand new applications.
- Models scheduled to re-run regularly and produce a set of metrics that will determine whether or not they are performing as needed.
- Meta-reports: regular reports on the state of the many models deployed in production, so that analysts can feel comfortable and in control.

Automation is the future, but it's not a bad thing - it will free up your time to work on even more innovative projects.
Trend 4: Collaborative Teams
Many organizations have been growing their analytics capabilities by building centralized analytics teams made up of analysts, data scientists, and subject matter experts. Perhaps you’re a part of one of these teams.
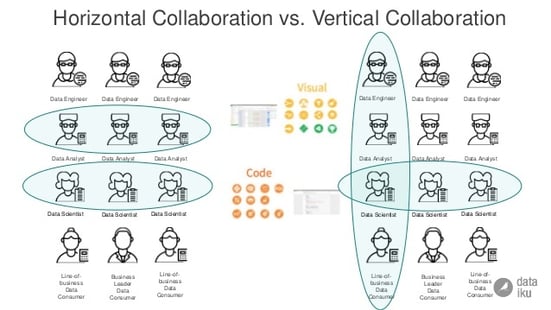
Businesses will start to move from horizontal collaboration among data teams to vertical collaboration among business units.
This structure is effective because it allows members of the team to share knowledge and expertise quickly, and because it gives the team greater visibility within the organization so that the insights it generates can be propagated and used. However, as these organizations mature, they’re finding that the best practice is to embed analytics team members within individual business units, where they face some new challenges with respect to collaboration:
- The value of collaboration is migrating from collaboration among analytics team members (horizontal collaboration) to that among business unit team members (vertical collaboration)
- More non-technical team members are engaging with data and models, so being able to involve them in the analytics process via graphical interfaces and dashboards is essential.
- Both synchronous collaboration – when multiple people work on the same project at the same time – and asynchronous collaboration – when different people can work on and refer to the same project but at various points in time – are key to a data-driven organization.