


In this blog post, we’ll illustrate how the Dataiku U.S. Census plugin works using a project to estimate house prices in five New England states, measuring whether U.S. Census data can bring a delta performance to this predictive model (the answer is, of course, yes, it does!). We’ll use Dataiku for the entire project, from scraping the real estate data from websites to creating and applying a predictive model.

The Value of US Census Data for Enrichment
The United States Census Bureau (USCB) has been surveying the U.S. population since 1903, and the sheer volume and quality of the data they publish is simply awesome. Among the many surveys the USCB performs is the American Community Survey (ACS), which is sent to approximately 3.5 million American households each year and upon publication offers more than 40,000 variables to researchers. The ACS gathers information on topics such as ancestry, educational attainment, income, language proficiency, migration, disability, employment, and housing characteristics. ACS offers the data at a level called “block groups,” which are geographically clustered groups of between roughly 600 and 3,000 people.
This wealth of data can be used by anyone, and it can be a great resource for enriching datasets. But this store of data is enormous, and it’s not exactly easy to understand, access, and incorporate this data into projects. That’s why we built a U.S. Census plugin for Dataiku, which connects to the USCB raw data, builds the dataset directly into Dataiku, and automatically chooses the most explicative variables or builds a custom dataset with a set of variables chosen by the user. The amount of time this saves - especially for users who aren’t well acquainted with the content and structure of the U.S. Census data - is massive.
Improving a Real Estate Prediction Model Using U.S. Census Data
The goal of our project is to see how much U.S. Census data can improve our ability to estimate house prices. Our original dataset is based on scraping real estate websites in five New England states: Connecticut, Maine, Massachusetts, Rhode Island, and New Hampshire. Among a number of variables (which we’ll discuss in more detail shortly), this dataset includes the house prices.
What we will do is take most of these records as our training dataset; that is, the dataset from which we will create our predictive model. The remaining records will constitute our testing dataset, which is the dataset to which we will apply the model and see how well it does in estimating the house prices on a house-by-house basis.
Then, we will use the U.S. Census plugin to create a dataset of Census variables, and we will join it with the original scraped housing dataset. Using the testing dataset, we will be able to see if the additional Census data improves our predictions, and if so, by how much.
One possible next step could be a recommendation system for houses, where if you identify an underpriced house, the system could recommend to you some other similar houses in the same area.
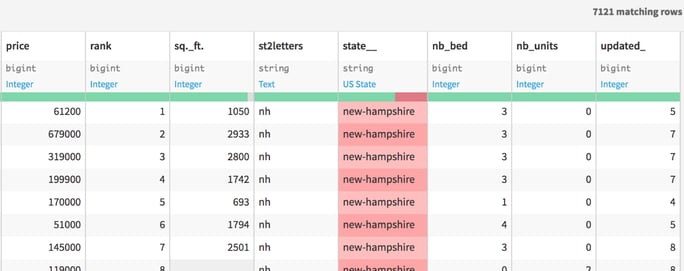
The first step in this project was scraping a random selection of URLs per county from a real estate website. This scraping was developed entirely in Dataiku. For each house listed, we collected the listed price, size, state, county, number of bedrooms, and latitude and longitude of the house, among other variables.
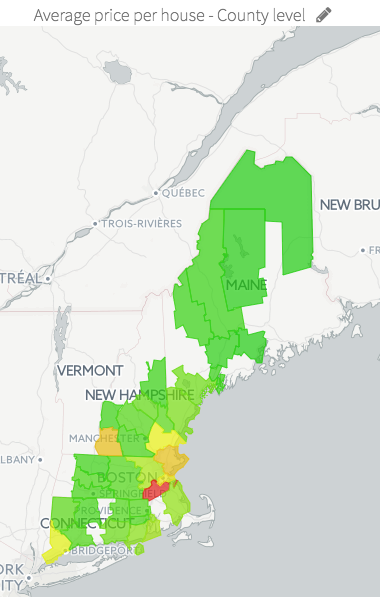
With this data, we are able to create some additional features, such as the distance from the state capital, for each house. If we pause for a second here, we can aggregate house prices at the country level and get a feel for what our data looks like. In this example, we create a map of average house prices by county -- red is most expensive, while green is least:
Joining and Importing Census Data
The next step is collecting the USCB data via the U.S. Census plugin. One of the main features of the plugin is that it automatically chooses the most explicative variables from the 40,000 offered through the ACS, thus saving an extraordinary amount of time and effort in identifying these variables on your own (and working with a massive, unwieldy dataset in order to do so).
This means that we need to define how we will join the real estate dataset with the USCB data before we even create the USCB dataset. For this purpose, I have built a separate plugin, called “get-us-census-block,” which takes latitude-longitude pairs and returns a “block group” -- the most granular level of data in the ACS data.
Once we have enriched our entire dataset with the block group, we are prepared to use the main plugin. Let’s connect our dataset to the recipe called “Census USA.” We can specify which geographical level we want, how many years of data we want, how many fields we want to import, and other options. We can also decide what format we would like the data in, as well as if we would like to keep it for further exploration.
The plugin handles the importing and the joining of the new dataset automatically. One of the key features of the plugin is that it allows you to be agnostic with regard to the 20,000 estimations fields, meaning that you don’t need to select and test which of these fields might be relevant to your target, because the plugin can run through each of the fields and select the most relevant fields for you automatically.
It’s worth pointing out how much time and effort this plugin can save you. I would estimate that a user using the ACS data agnostically (so not looking for specific fields), starting with no familiarity with the raw data, would need days or even weeks of full-time work to incorporate this data, including understanding the USCB file structure. With the U.S. Census plugin, it takes anywhere from just minutes to up to an hour depending on which states you have to process (e.g., Washington, D.C. or Delaware vs. California or Texas).
Census Features Drive the Model
Once the U.S. Census plugin had chosen the top ACS variables to use in the model, it was time to answer the question: was any of this worth it? In order to evaluate the census data, we had to run the model twice, first without the ACS data and then with it.
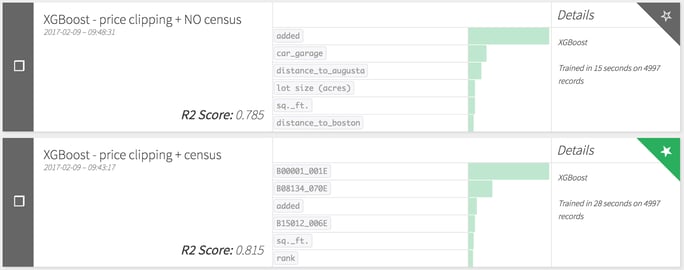
As you can see in the chart above, we use two XGBoost (a type of gradient boosting) models, and the model with the ACS data outperforms the simpler model with an R2 score of .815, compared to .785 for the model without the ACS data. This is using the same training and testing datasets, so we are comparing apples to apples.
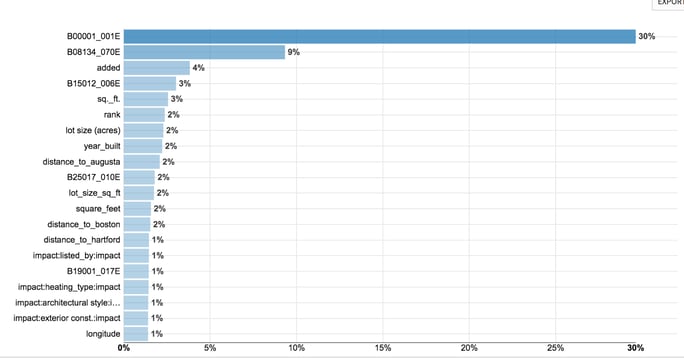
Looking at the model with the full dataset, we can see which variables had the biggest impact on the predictive power of the model. (Note: the chart below tells us which variables had the most impact on the model, but it doesn’t tell us in which direction the variable pushes the prediction or whether there is a linear relationship at all.) Three of the top four variables come from the ACS data. The key to the data codes is not visible here, so without further ado, the top Census variables in this model are:
- Population density of the block
- Commuting distance to work
- Total number of bachelor’s degrees in science, engineering, and social sciences
We promise we didn’t make that last one up!
We were also surprised that the #6 variable was “rank,” a variable that simply reflects the rank order of a property on the website when sorted by “pertinence” -- this suggests that there may be some sort of effect of the website showing better prices (for either buyers or sellers) among the first properties featured.
Conclusion
While our model is strong, we can always look for improvement. For example, we could probably improve performance of the model with more data on the entire set of counties. Still, in this type of model we would never expect to perform too much better because the real estate business involves a lot of negotiation, and prices listed on a website could differ widely from actual prices.