Previously, we’ve discussed regression and classification algorithms, and now that you're an expert in these types of supervised learning, it's time to delve into unsupervised learning. Specifically, clustering models.

Unsupervised learning means that we’re not trying to predict a variable. Instead, we want to discover hidden patterns within our data that will let us to identify groups (or clusters) within that data.
Clustering is often used in marketing in order to group users according to multiple characteristics, such as location, purchasing behavior, age, and gender. It can also be used in scientific research; for example, to find population clusters within DNA data.
K-Means: Centroids and Midpoints
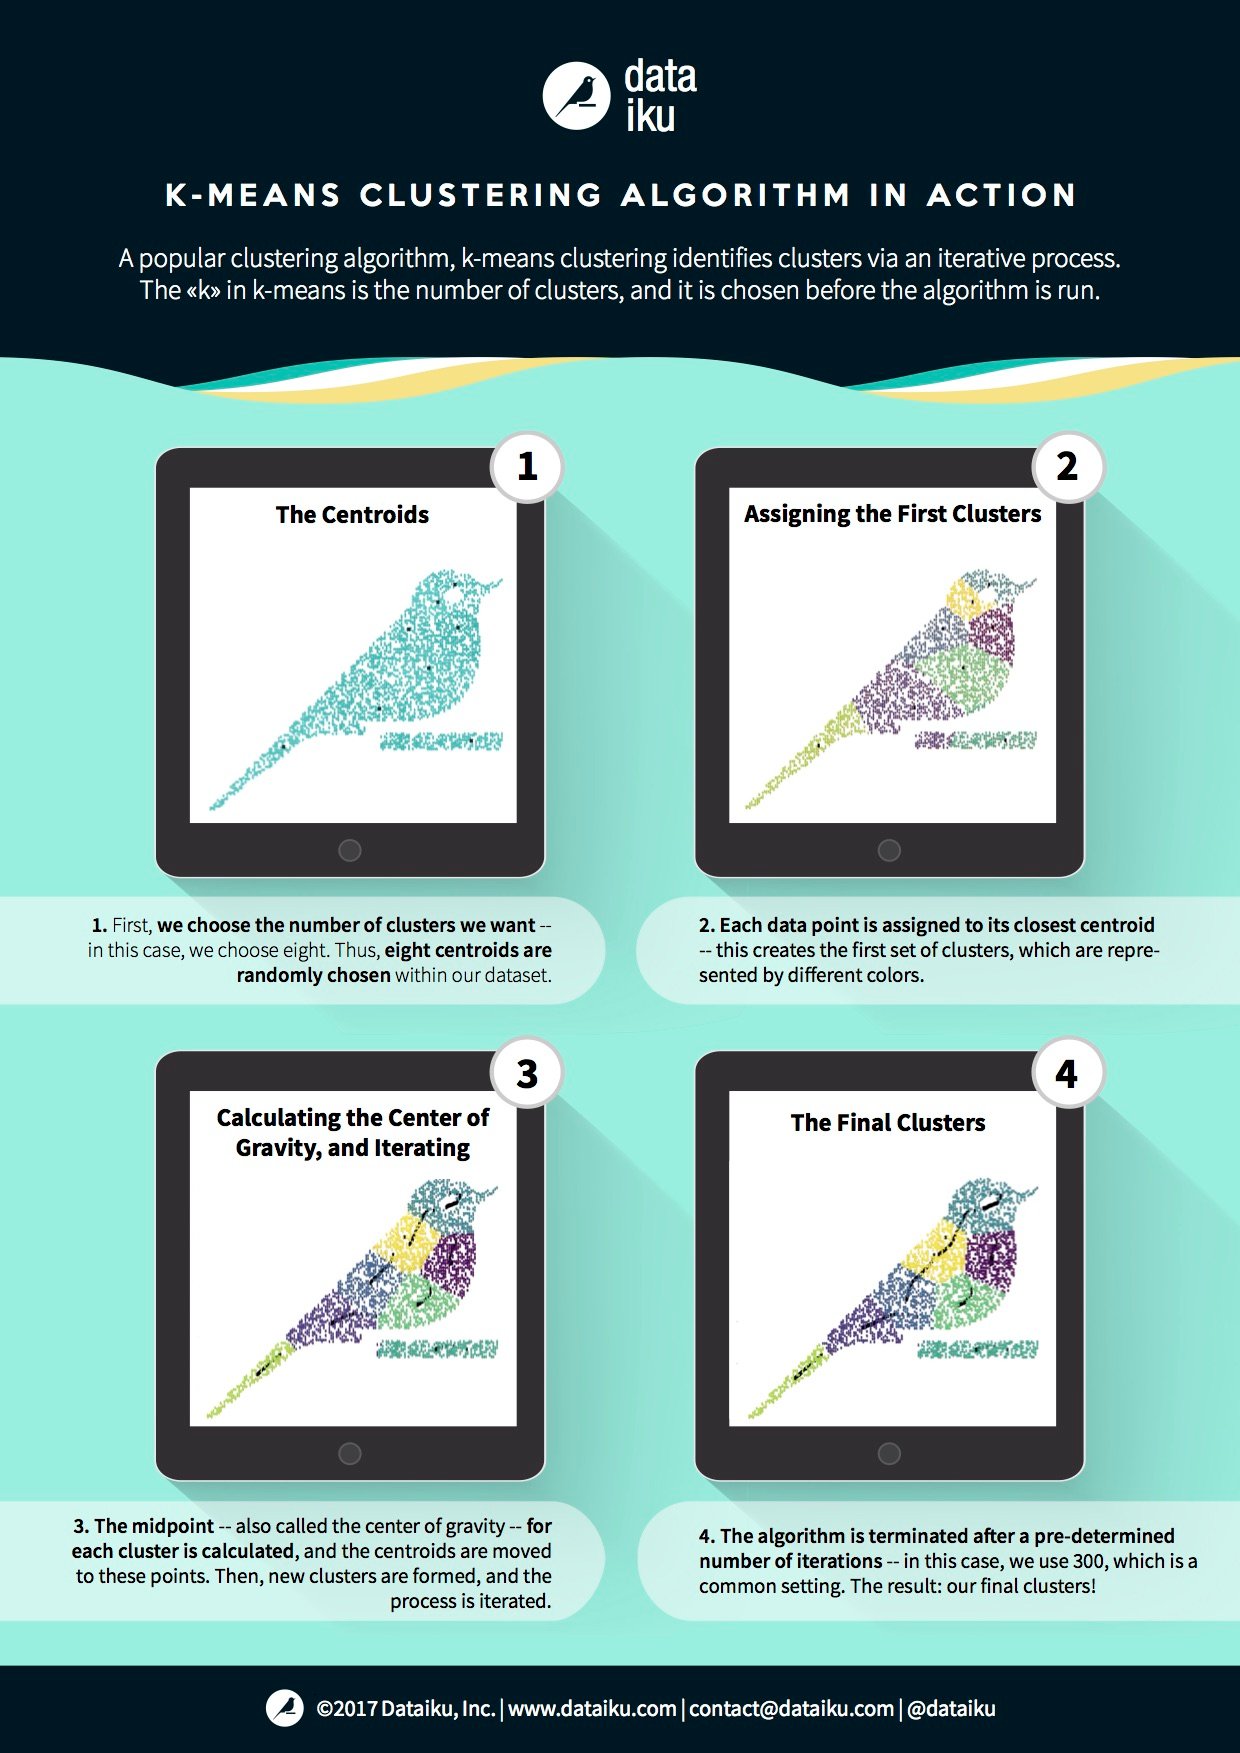
The most widespread clustering algorithm is called k-means clustering. In k-means clustering, we pre-define the number of clusters we want to create -- the number we choose is the k, and it is always a positive integer.

To run k-means clustering, we begin by randomly placing k starting points within our dataset. These points are called centroids, and they become the prototypes for our k clusters. We create these initial clusters by assigning every point within the dataset to its nearest centroid. Then, with these initial clusters created, we calculate the midpoint of each of them, and we move each centroid to the midpoint of its respective cluster. After that, since the centroids have moved, we can then reassign each data point to a centroid, create an updated set of clusters, and calculate updated midpoints. We continue iterating for a predetermined number of times -- 300 is pretty standard. By the time we get to the end, the centroids should move minimally, if at all.
DBSCAN: Ready, Set Your Radii... Go!
Another simple clustering algorithm is DBSCAN. In DBSCAN, you select a distance for your radius, and you select a point within your dataset. Then, all other data points within the radius’s distance from your initial point are added to the cluster. You then repeat the process for each new point added to the cluster, and you repeat until no new points are within the radii of the most recently added points. Then, you choose another point within the dataset and build another cluster using the same approach.
DBSCAN is intuitive but its effectiveness and output rely heavily on what you choose for a radius, and there are certain types of distributions that it won’t react well to.
Evaluating Clustering Models
There aren’t many metrics to evaluate clustering models, because much of their value is subjective. Still, we have a few metrics we can briefly introduce:
Inertia: The sum of squares of each cluster, summed across all clusters. Inertia measures how tight the clusters are, so, in general, you want a smaller inertia. The more you increase k, the lower the inertia will be. In order to estimate whether adding another k will improve your clustering significantly, you can use an approach called the elbow method, where lets you visualize the value of adding another k.
Silhouette: A metric of what would have happened in terms of inertia if each point had been assigned to the next-nearest cluster. A silhouette of 1 implies that each point is in the right cluster, and a silhouette of -1 means that each point is in the wrong cluster. It’s better to be closer to 1!