


Ever wanted to know more about the people behind your favorite Enterprise AI platform? You're in luck — every few weeks, meet one of the humans at Dataiku working every day to ensure customers and users find success on their path to Enterprise AI. This week, we met with Sofiane Fessi, Head of Sales Engineering, Central Europe and assigned a very special data project to him! Read on for a new spin on how to get to know someone (hint: your Netflix account will come in handy!).
Learn About Sofiane...The Traditional Way
Before joining Dataiku, I was a data scientist working for a digital marketing agency in London. I came across the company through a friend who was one of the first Dataikers, watched a demo, and realized that I wanted to work at Dataiku, even if I had no experience as a sales engineer. Thanks to a thorough onboarding and learning process, I very quickly started traveling all around Europe and the Middle East to meet with customers.
I spent two years learning about all things data science and architecture, discovering organizations and teams from all industries and at various levels of AI maturity. I also developed a clear ability to translate technical assets into business value. All of this led me to my current role as a lead for Central Europe!
We could have ended the introduction of Sofiane here. But, at Dataiku, we love experimenting, testing new ideas, and adopting a data-driven strategy. We landed on a fun approach — Sofiane used Dataiku (“the product he fell in love with”) and his personal Netflix data to tell a story. Learn more about him in a unique (and data-backed) way in the next section.
 Sofiane (on the right) with other Dataikers (Arthur, AE and Maxime, SE) in Malta
Learn About Sofiane...The Data-Driven Way
How I Explored My Netflix Data in Dataiku
The dataset you can get from your own Netflix account is a simple list in CSV format of what program you watched with a date. It’s easy to get the list — when you log in to Netflix, go to “Account” (top right), scroll down to “Profile and Parental Controls,” and find your account. Go to “Viewing Activity” and press “Download All.”
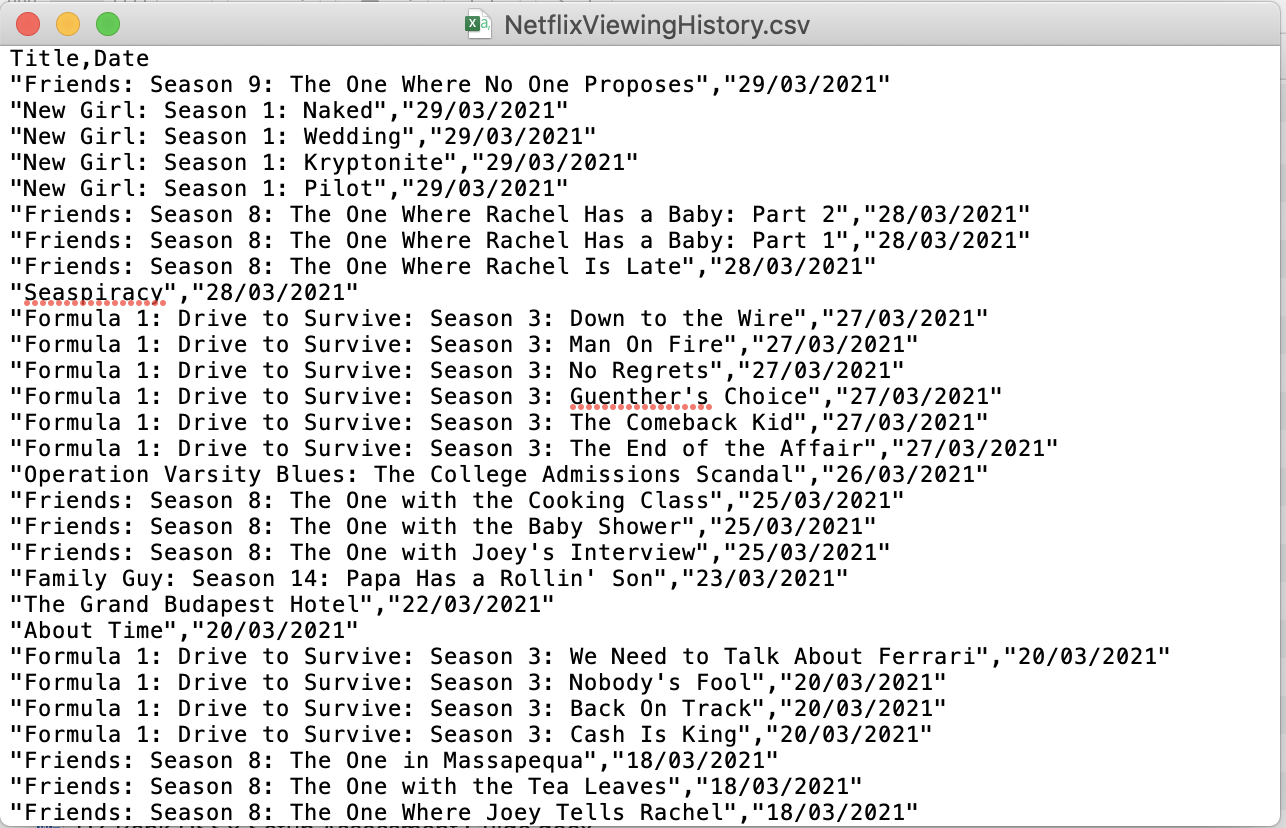
Upon opening the file in Dataiku, we get the CSV formatting in tabular form.
What I wanted to do with this data is get a bit of insight on what shows I watch the most and when I watch them — all while using the awesome capabilities of Dataiku when it comes to NLP, data exploration, data prep, charting and dashboarding, etc. And I wanted to do all of that in about 30 minutes.
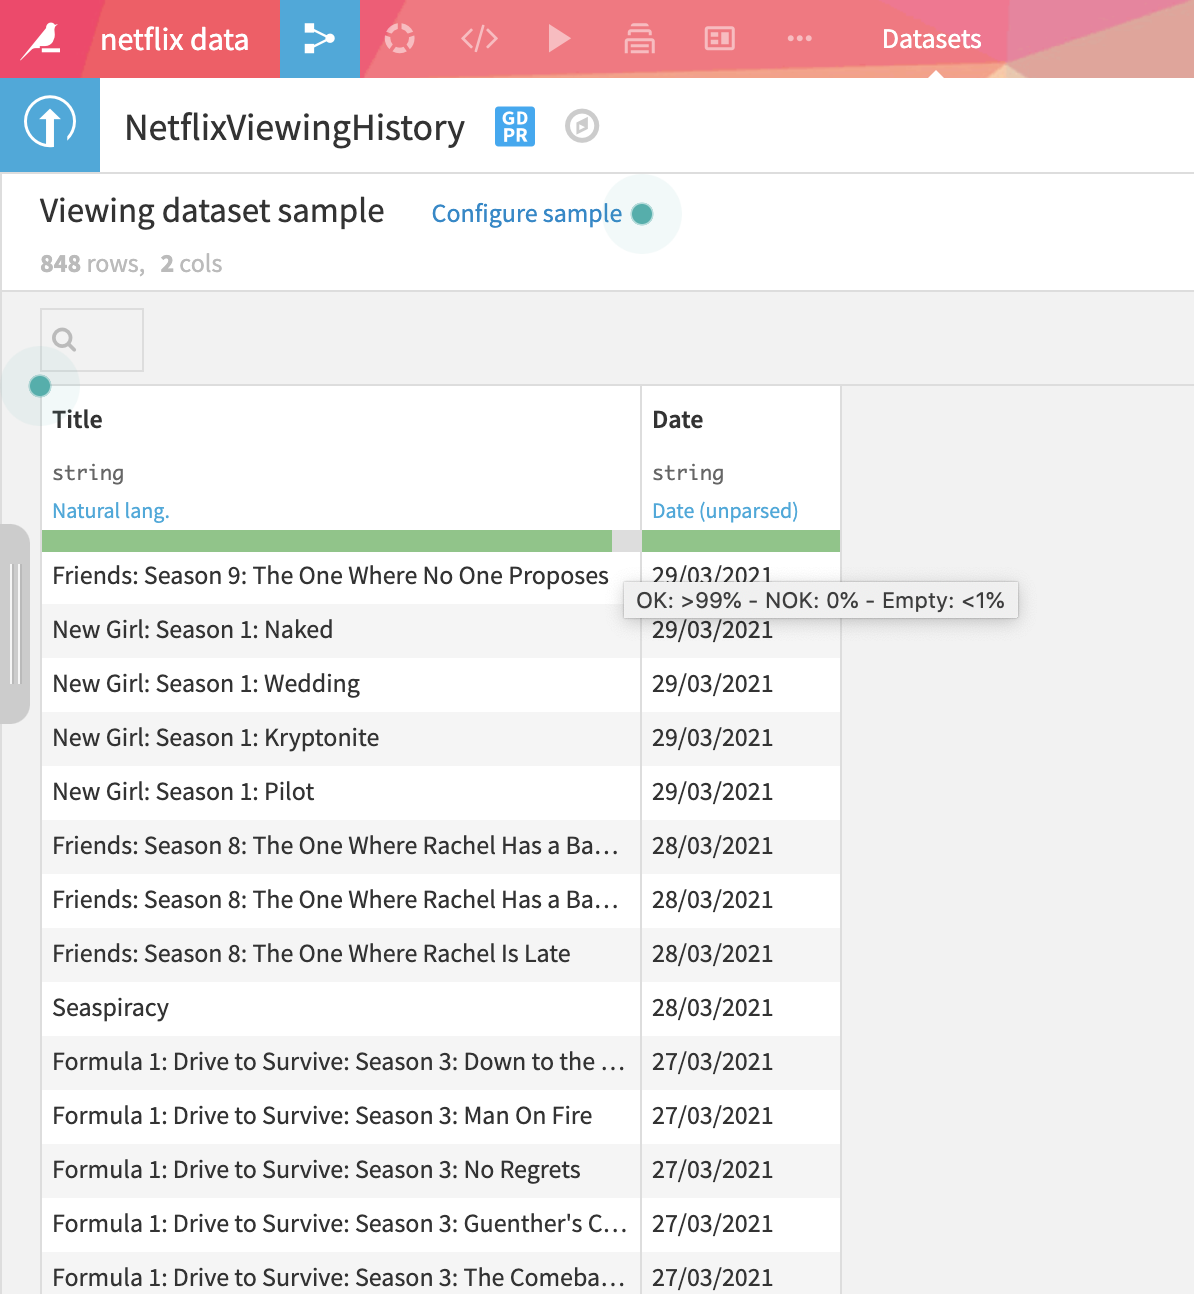
Upon first exploring this dataset, we can see there are 848 rows, each row representing a program watched (a movie or an episode). We can also see the dataset is pretty "clean" since we have less than 1% missing data and 99% valid data.
Since in the dataset we only had this "program watched" and a date column, I was able to use Dataiku to generate more features in just a few minutes.
Working with dates: In Dataiku, you can really extract quite a bit of information from a simple date column, like we have in the Netflix dataset. The first step was to parse the date column in order to allow Dataiku to make computations from the dates. From that, I could plot my watch history over time, but also extract day of the week information, month of the year, time of day, etc. All of that allowed me to very easily plot this time information on charts and dashboards in about five minutes from the raw data.
Working with text data: You can see in the dataset that the programs watched are named exactly how they appear on Netflix — one row per program watched. It’s mostly series that I watch on Netflix and, with the current shape of data, we need to do a bit of transformation in order to aggregate each episode watched into their own series.
I used the Dataiku prepare recipe and text processors to:
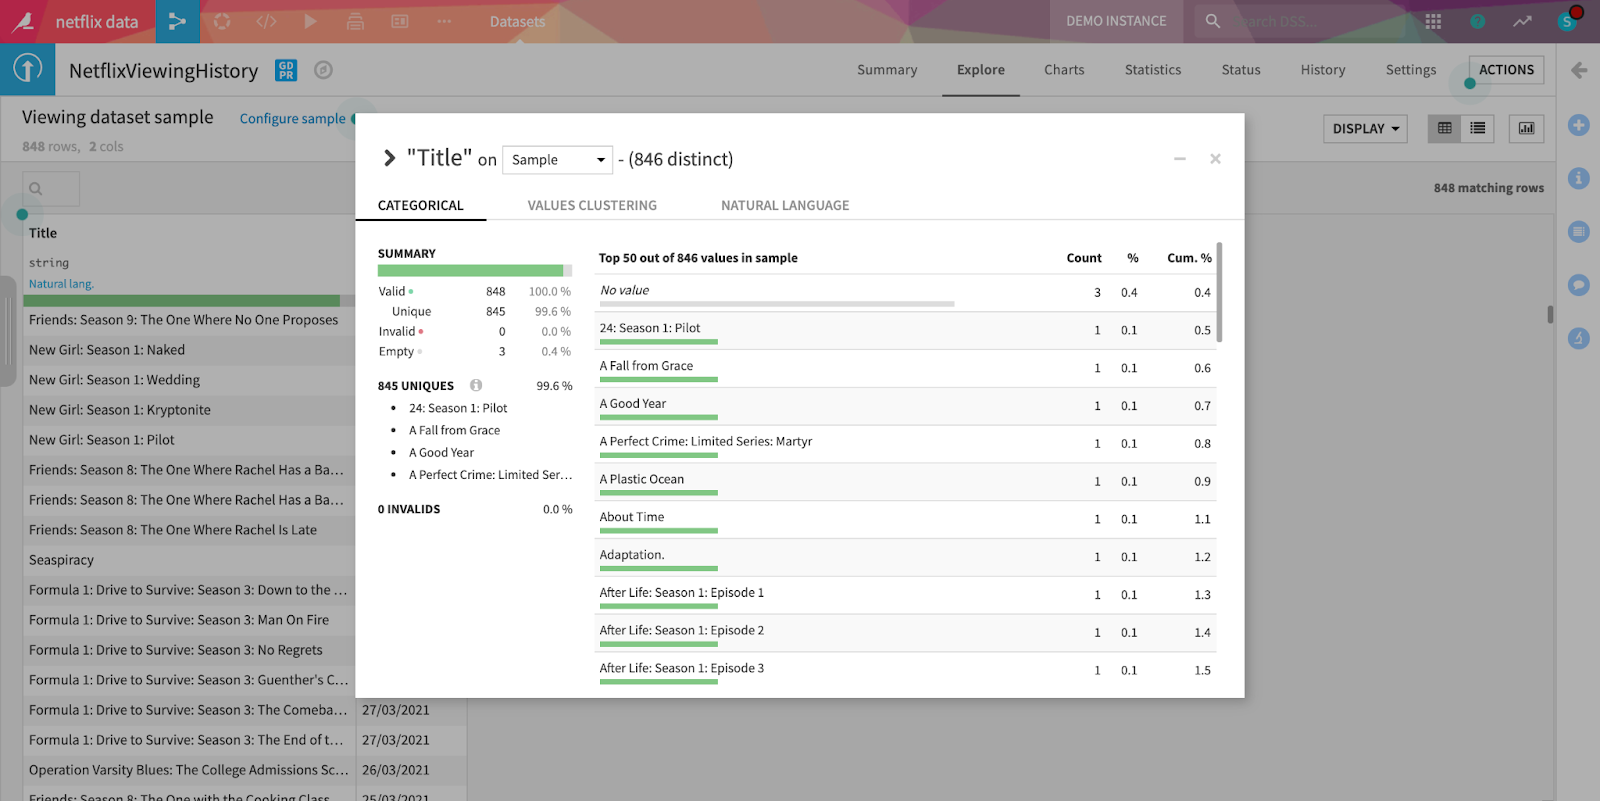
- Create labels of series which I can use to aggregate episodes and count, for example, how many times I watched “Friends” or “The Queen’s Gambit.” For this, I used Dataiku to normalize text (put it all in small caps) then remove stop words and, finally, to extract 2-gram sequences.
- Identify what program was considered a series by labeling each item that contains the word “season” to get an idea of what percentage of series versus non series I watch. For this I used one of the new features of Dataiku called Smart Pattern Builder to extract information from data using regex. Smart Pattern Builder allows easy text extraction and pattern spotting without regex mastery by selecting desired string(s) for extraction. Then, I received multiple smart patterns to pick from and chose the pattern with the best results.

Thanks to this, I went from two columns to 12 columns in a few minutes, doing nonbasic operations like NLP, working with dates, etc. This shows the power of data, we can gain a lot of valuable insights from very little!
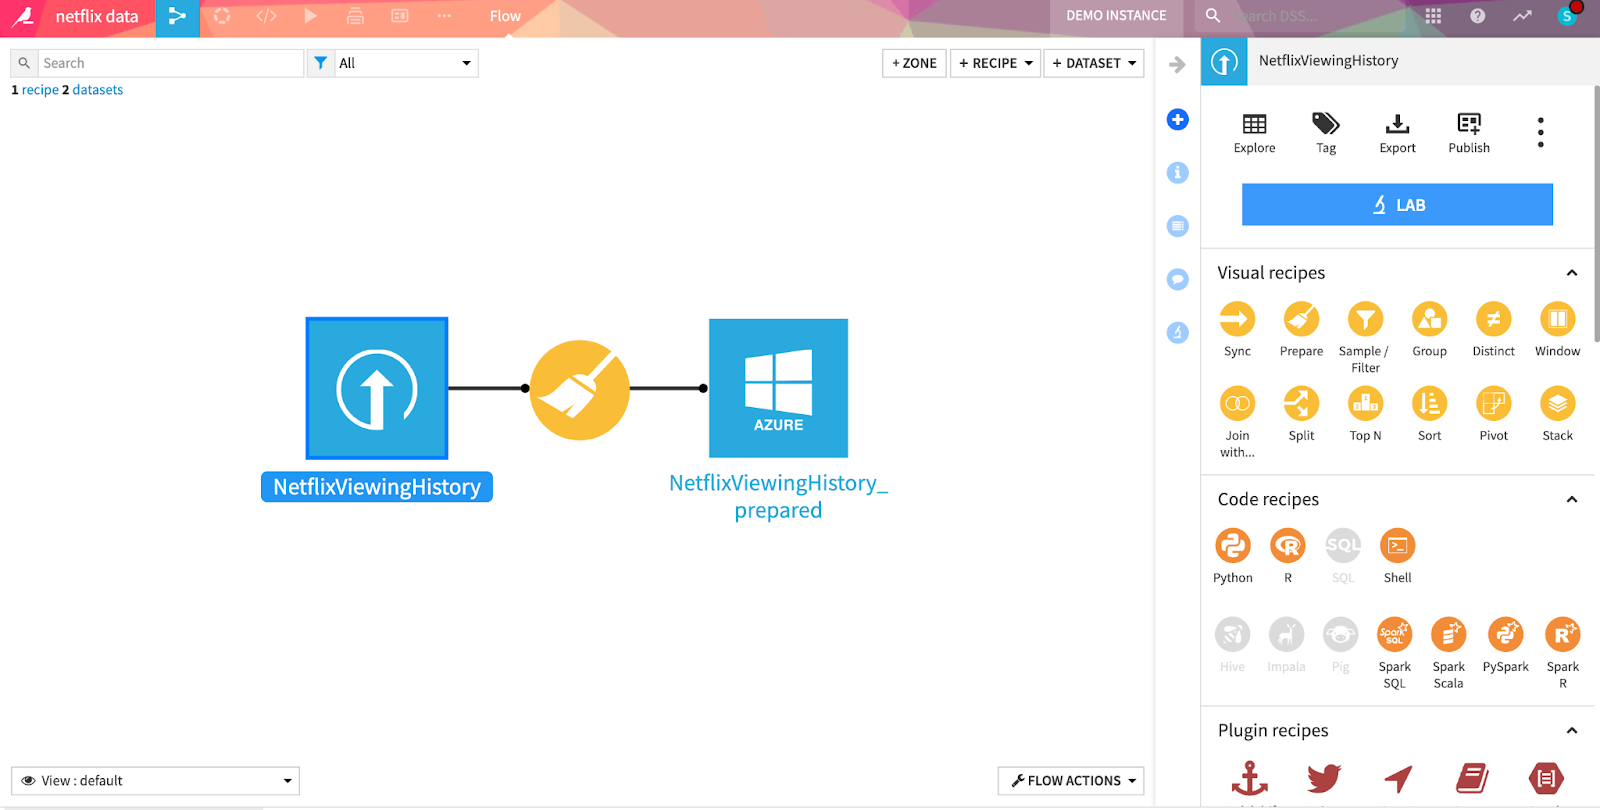
It is worth noting that all of that happened in only one step in my Dataiku flow (pipeline) with my raw CSV dataset on the left and the transformed data on the right, with my prepare recipe in the middle where all of these transformations happened (date, text processing, etc.). In this example, you can see it’s very easy to push data to different connections with Dataiku. In this case, my output dataset is stored on Azure. You can see the full list of Dataiku connectors here.
Now, we’re ready to plot some of this data. In a couple of clicks, I am able to plot the percentage of movie or show plays on each day of the week.
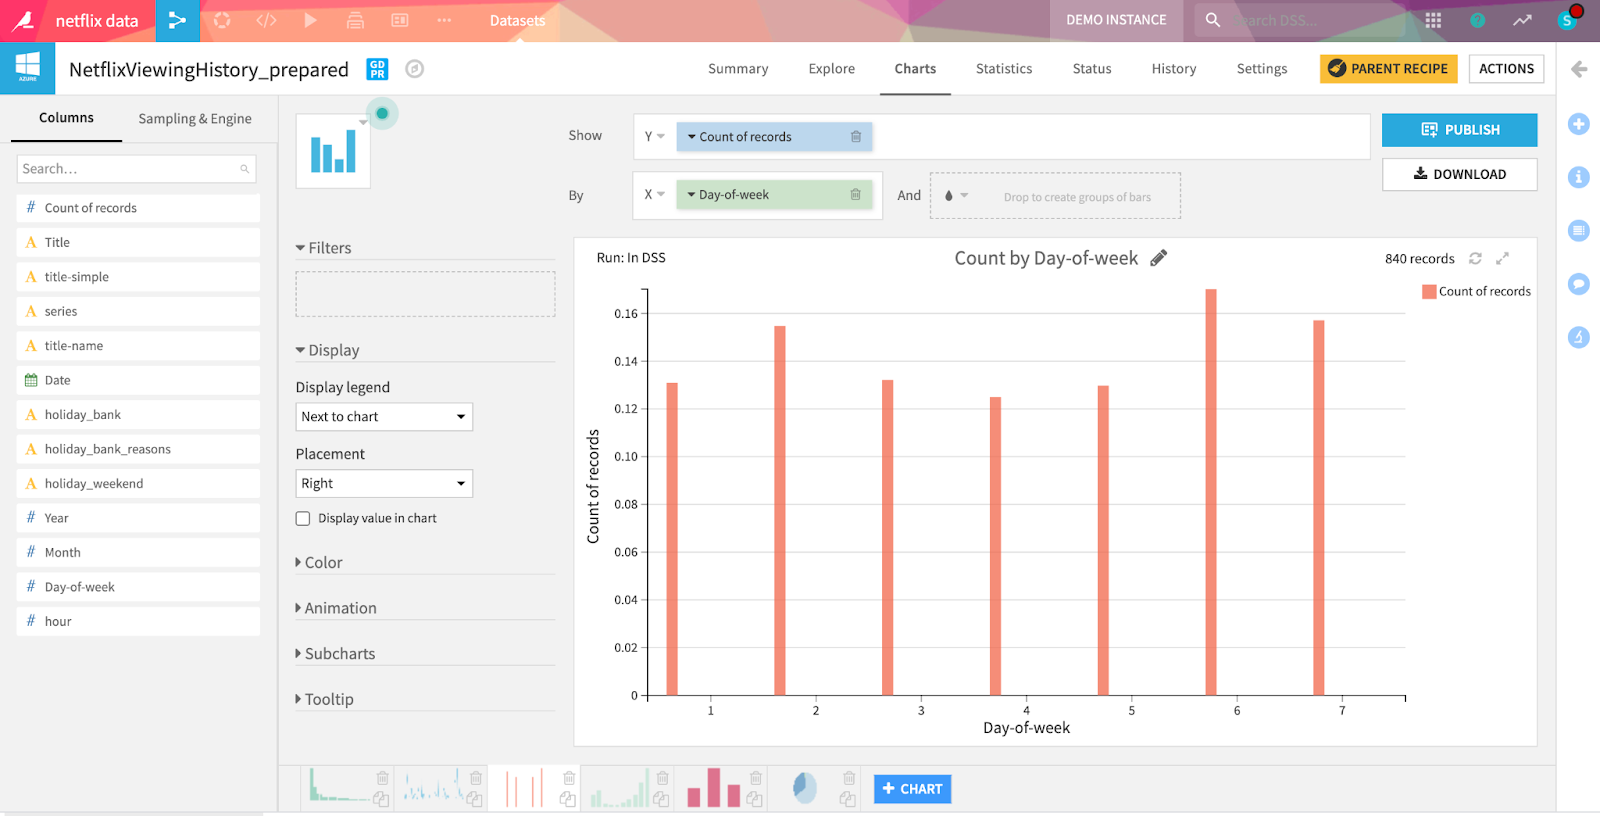
And now that my graphs are ready, I can put them in a dashboard.
What Does This Data Say About Me?
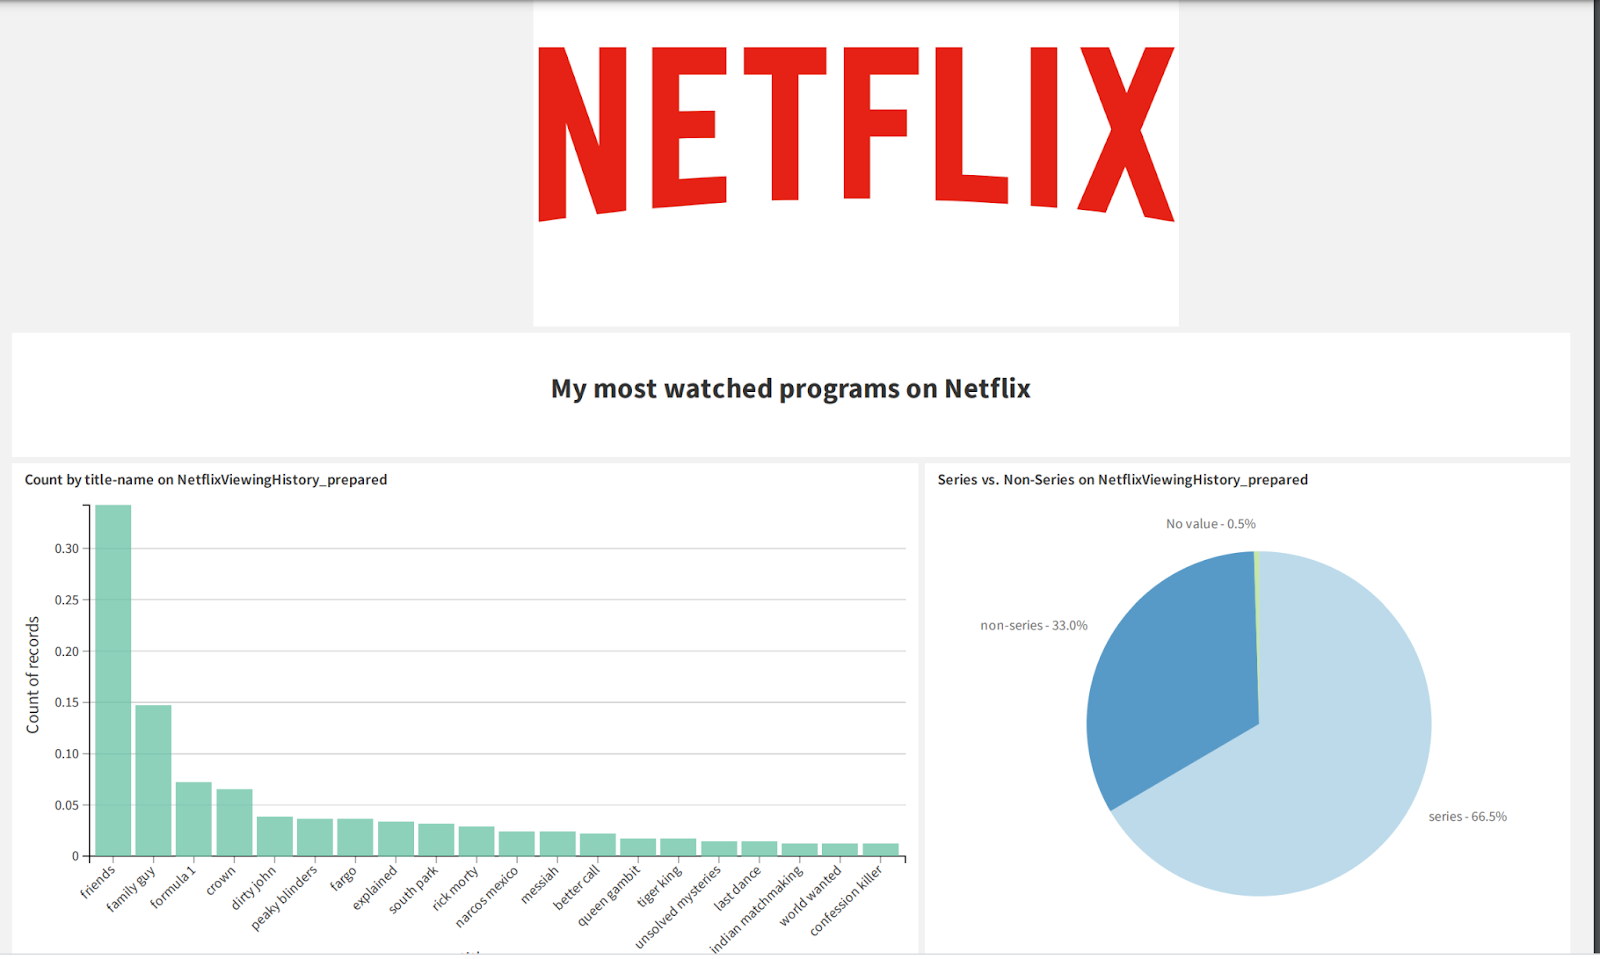
The shows I watch most often are...
- “Friends”: It's an easy go-to and one of the things my partner and I can watch easily. She's more about lighter, feel good movies and I'm more into historical films, thrillers, and war movies (surprising right?). “Friends” is a great flashback to my high school years rewatching those! I thought I remembered everything but actually quite the opposite. Also, I love any movie/series that takes place in New York.
- “The Crown”: Speaking of historical content... I’m not really into the monarchy but what I found interesting in “The Crown” was how it covers the second half of the 20th century and the politics of the time. I’ve already been curious about this time of our history, the Cold War, etc. and “The Crown” is interesting in that sense.
- “Formula 1 - Drive to Survive”: I was not really following F1 but this docuseries put me right into it, to the point that I've started watching the races live. I like how the series dives into the story of each driver and each team. As we can expect, a lot of the drivers come from privileged backgrounds (or race car driving runs in their families), but some of them come from families that sacrificed everything for their kid to become a pilot, like Lewis Hamilton or Esteban Ocon. That, combined with the drama of the races and the competitions between the various teams at all levels, makes it an exciting watch if you’re into sports.
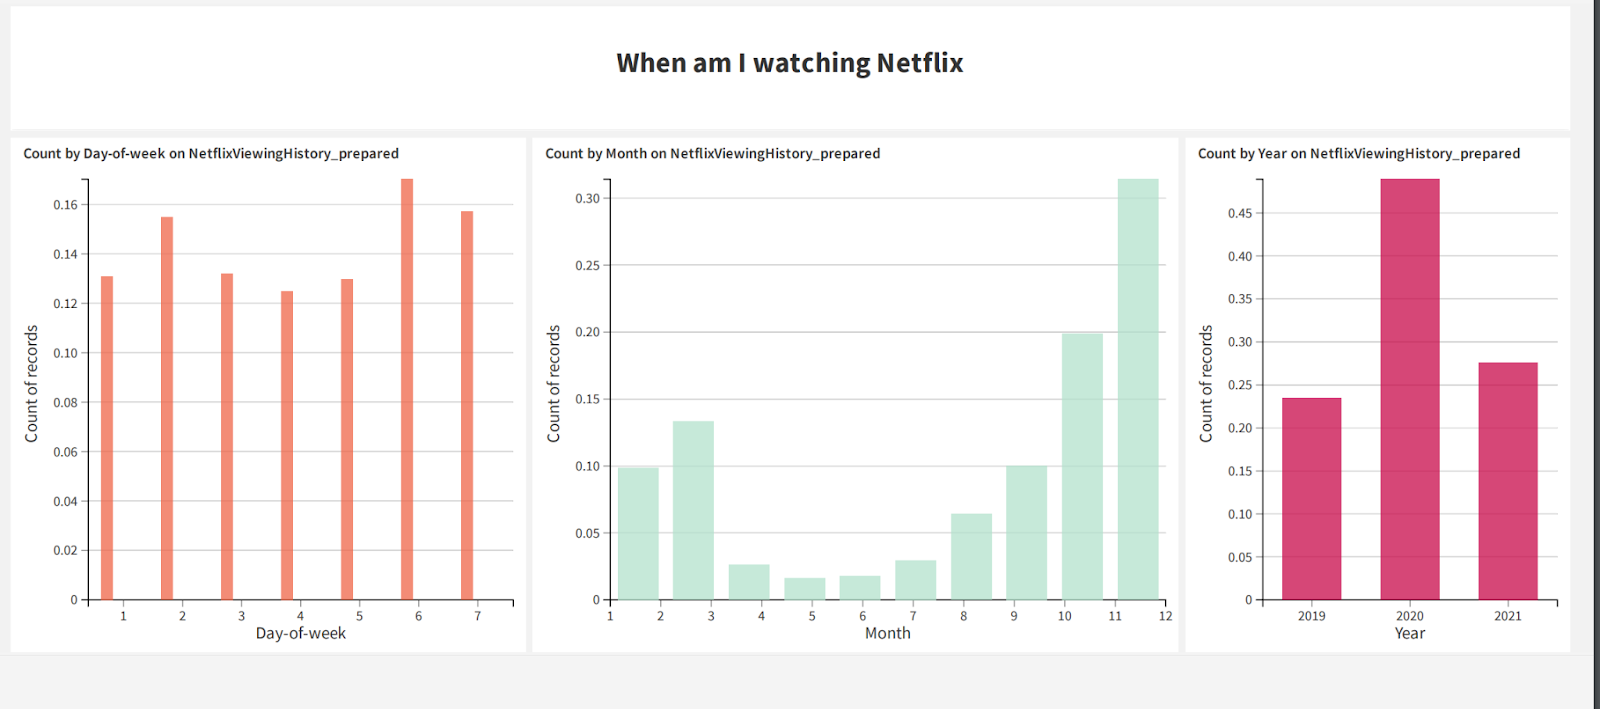
I most often watch Netflix when...
Looking over the last two or more years, you can see a clear bump up between before and after Covid. The number of programs watched in 2020 was more than double that in 2019. Like many people, I guess being locked at home seriously increased our consumption on Netflix.
Next, I looked at the number of views per month over a year. There are also clear seasonality trends with more views in the colder seasons than in the spring and summer. There again no surprise, we’re just not really watching it when it’s nice and warm outside. On the other hand, it’s definitely something we do more of when dealing with Berlin winters! Similarly, over aggregated data per day of the week, you can see we have more plays on weekends. I hope you enjoyed this unique way of getting to know me (and how Dataiku made it easy!). Check out what your Netflix data says about you!