In May 2020, Gartner’s Top 10 Trends in Data and Analytics put the evolution of the dashboard, the crown jewel of business intelligence (BI) initiatives at companies worldwide, in the spotlight. As machine learning (ML) and AI techniques move in, automating tasks like data preparation, ML model creation behind the dashboard, and even insight discovery, the future of BI looks very different from what many organizations do now.
Dataiku and Tableau have been partners for the past several years, working to move the needle on data democratization and helping users share data stories across the business. With the release of Dataiku 8, Tableau users can now quickly and easily unlock predictive insights from their user interface with three new features:
Dataiku AutoML Insights Tableau Extension
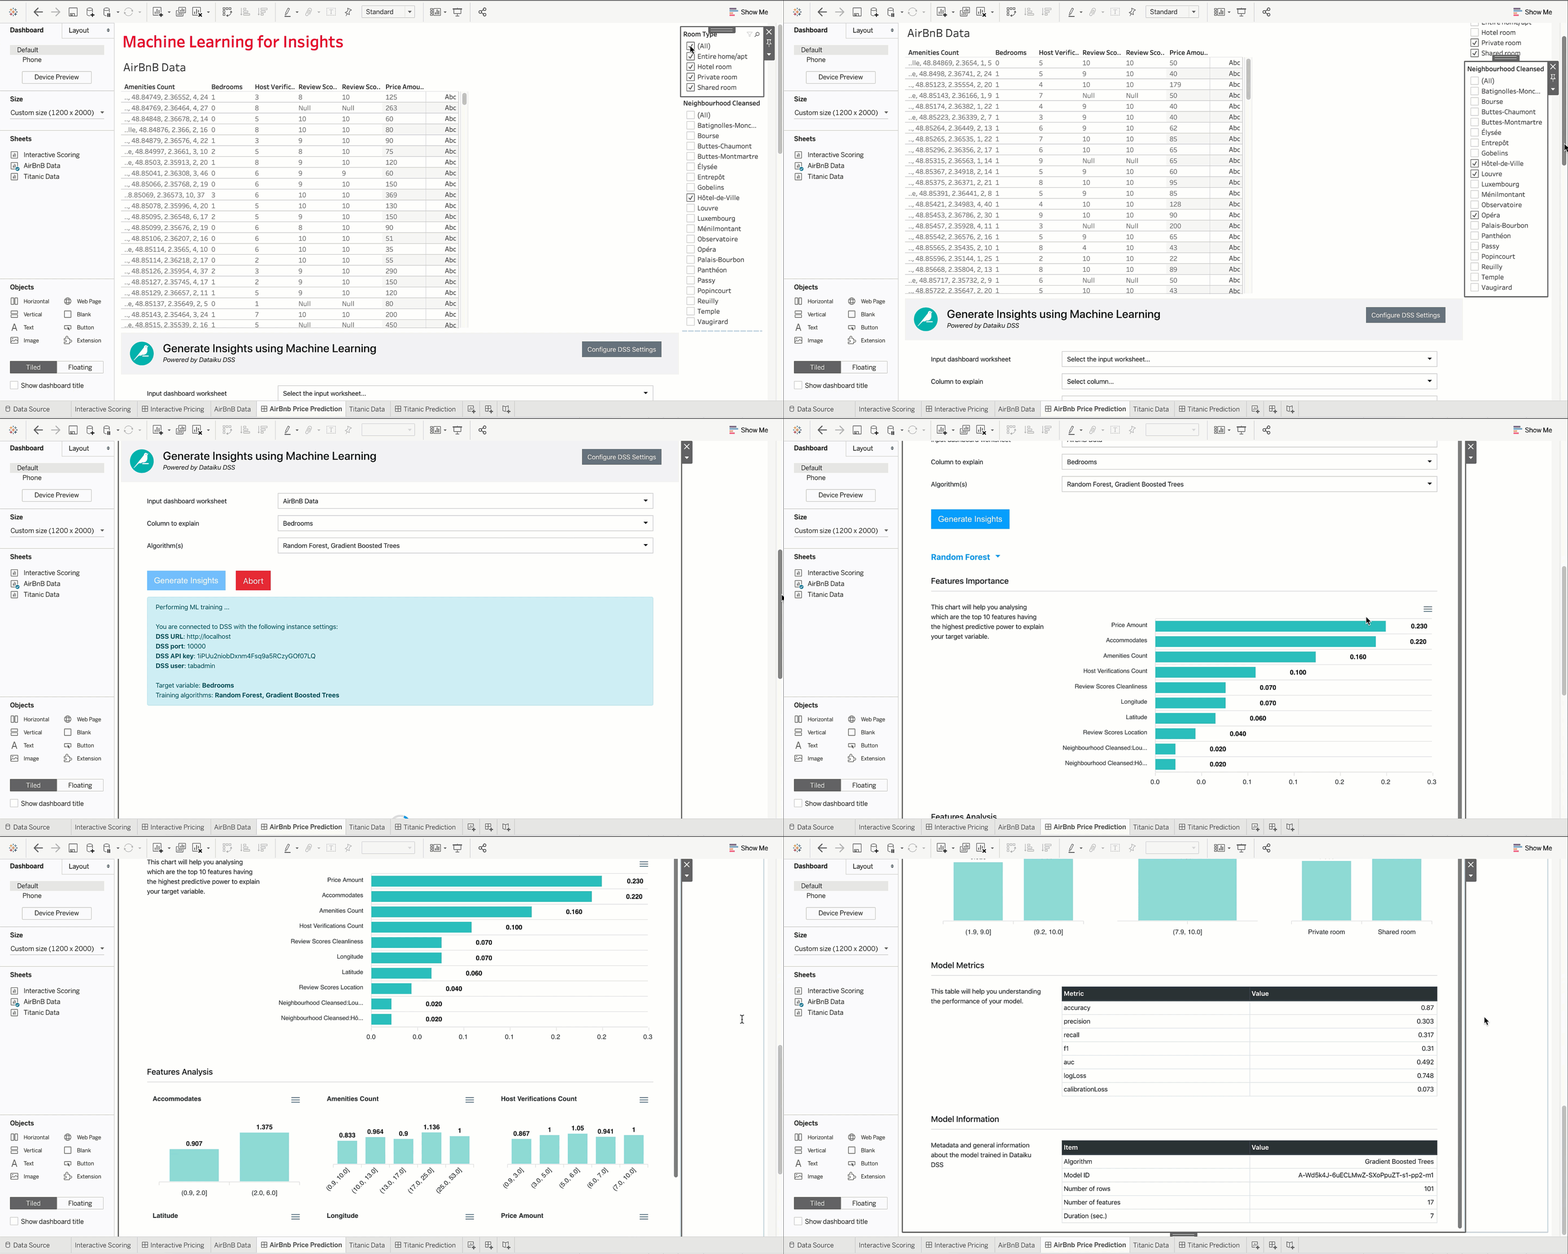
The new Dataiku AutoML Insights extension enables all Tableau users to train ML models on the fly (with support for all major machine learning models), then visualize and interact with key model metrics inside Tableau.
For business analysts, this means:
- Exploring data using predictive analytics and garnering insights that go beyond Tableau’s built-in analytics , including exposing the quality of data for machine learning.
- Easily sharing the results with the rest of the organization using dashboards or visualizations to prove data-readiness for advanced machine learning.

Dataiku AutoML Insights In Action
For example, let’s take a dataset containing Airbnb pricing data for Paris and see how the Dataiku AutoML Insights Tableau extension can further our understanding of the data. The ultimate business goal in this example is to be able to accurately price your Airbnb for the market it’s in, understanding what are the most important factors that determine price (e.g., location, number of bedrooms, number of guests the Airbnb can accommodate, etc.).
By selecting “Accommodates” as the column to explain as well as Random Forest and XGBoost as algorithms, Dataiku AutoML Insights returns a visualization showing which other variables would best predict the number of guests. In this case, those predictors are “Bedrooms” and “Price.” Feature Analysis charts help give a visual understanding for how the number of guests map to other variables in the data.
To follow along with this example more closely and to try out Dataiku AutoML Insights yourself, download the Tableau workbook*. The “Insights" Dashboard shows Dataiku AutoML Insights, and further instructions on how to use the extension can be found in the reference documentation.
Tableau Hyper Plugin Upgrades
The Dataiku Tableau Hyper Plugin has enabled seamless interaction between Tableau Hyper format and Dataiku DSS datasets for years, but the just-released version brings significant upgrades, including:
- Improved performance of up to 2x across all dataset sizes by leveraging the Hyper API
- Integration of the latest capabilities of Hyper API to enable reading of .hyper files into Dataiku DSS

The Dataiku Tableau Plugin In Action
Let’s continue with our Airbnb use case. A user can directly read the full dataset of Airbnb data from Tableau into Dataiku DSS using the latest version of the Tableau Hyper Plugin. Using Dataiku DSS, that user cleans the dataset, joins it with other datasets, and prepares it for training.
From there, a more advanced model for predicting the price of an Airbnb can finally be trained and deployed to batch score new Airbnb data. This scored data is then exportable back into a Tableau dashboard to create rich and interactive visualizations to share with the larger organization.
To see the Dataiku Tableau Plugin applied, download the Tableau workbook* if you didn't already for the previous example. The "Price Predictions" Dashboard shows all of the visualizations that can be generated by using the Tableau Plugin after using a model to score data.
Row-Level, Real-Time Predictions with TabPy
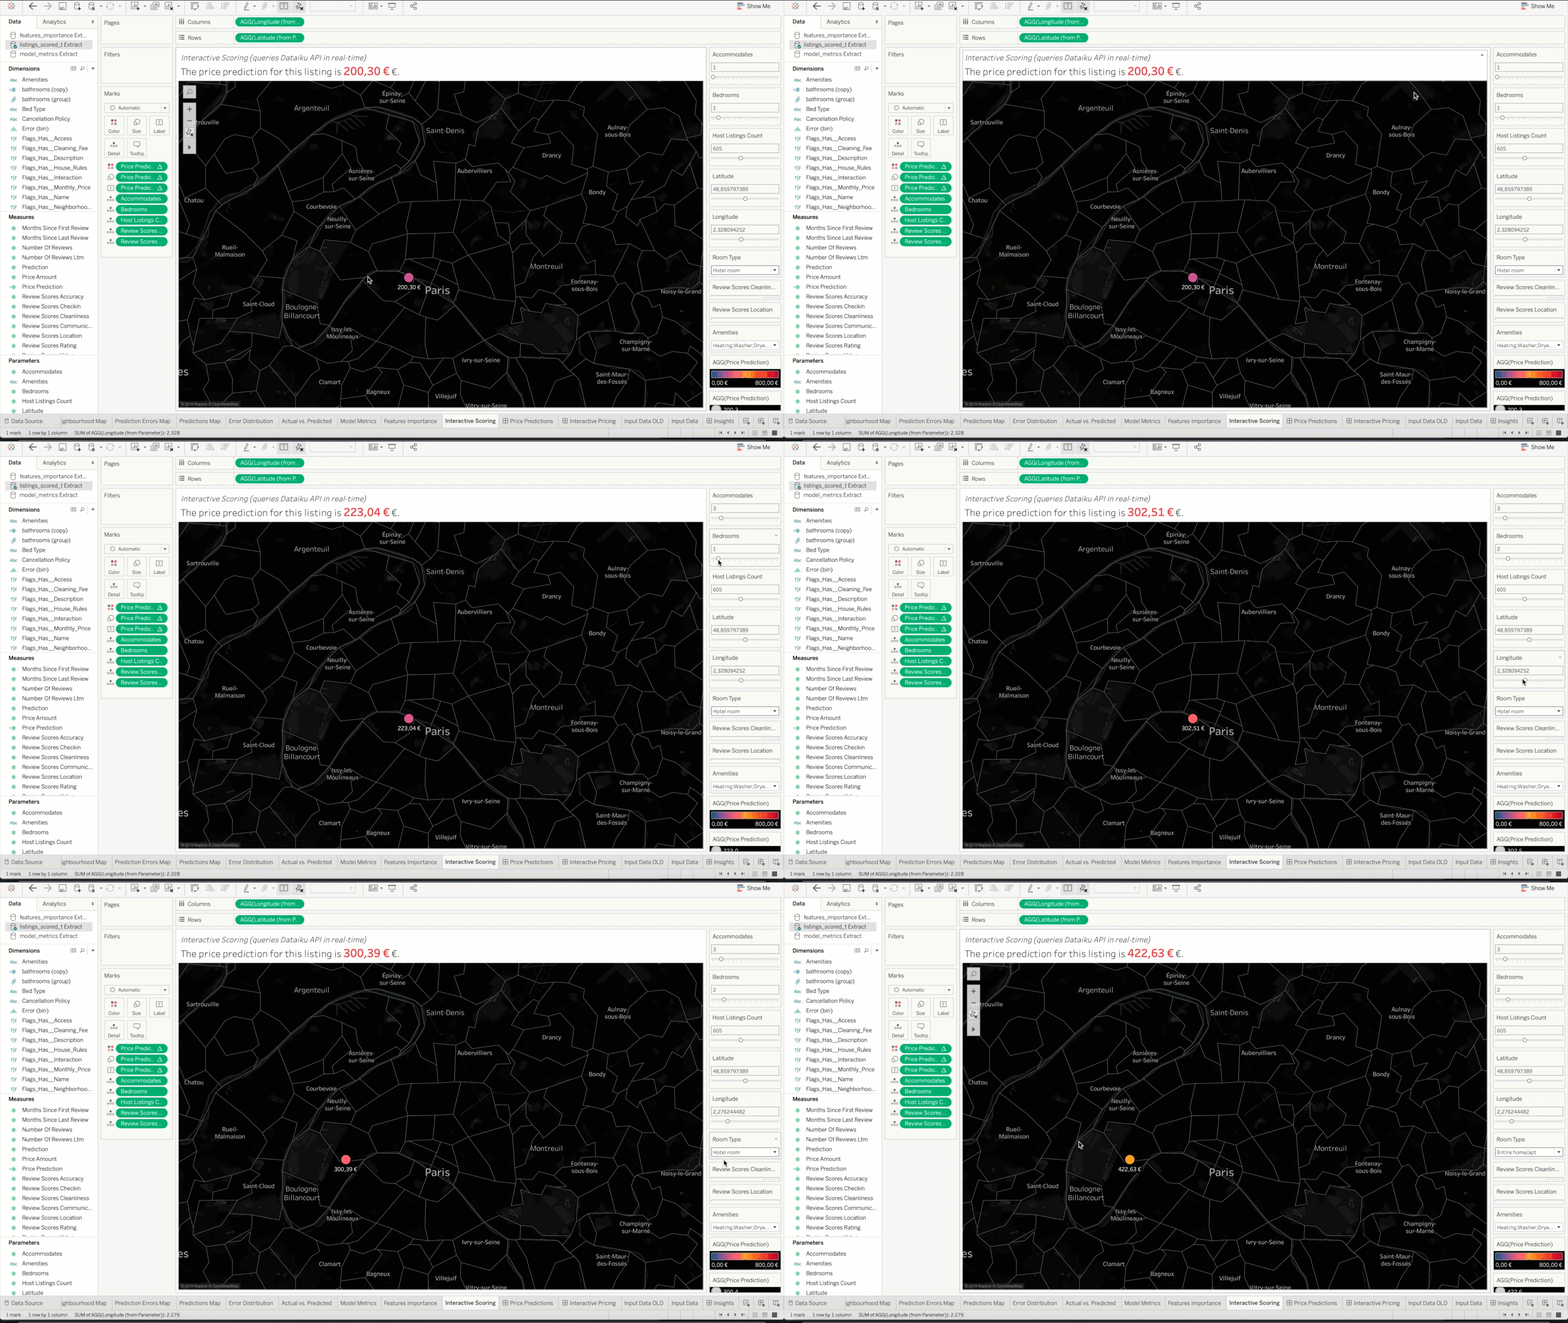
With the combination of Dataiku’s API node and TabPy, all Tableau users can receive row-by-row predictions from a deployed Dataiku DSS model within a Tableau workbook.
- After creating and training a model in Dataiku DSS, Dataiku users can deploy their model using the API deployer and bring the created endpoint to Tableau.
- By defining the input variables to be sent to the API, as well as the expected results, Tableau users can incorporate predicted values into their Tableau Dashboard in an interactive way.

Tableau Real-Time Predictions, Powered by Dataiku, In Action
Once again using the Airbnb data example, a data scientist is able to take the insights generated from the Dataiku AutoML Insights extension to create a more advanced and robust model for predicting Airbnb prices. They can deploy that model to Dataiku’s API node and create a calculated field in Tableau using the endpoint URL.
Tableau dashboard users can then select values for any expected input (e.g., number of guests or location) and get an immediate prediction on the price for this AirBnb within the dashboard. This same workflow can be applied to any use case and any interactive Tableau dashboard.
To see it in action yourself, download the Tableau workbook* if you haven't already. The "Interactive Pricing" Dashboard shows an application of the TabPy integration — note that you’ll need to run a TabPy server for this dashboard to work.
*A Tableau license is required to use the workbook. Upon opening the workbook, you’ll be asked to run a calculated TabPy field and give access to the AutoML Extension. Click Yes/Accept to both.


