At Dataiku; we want to shorten the time from the analysis of data to the effective deployment of predictive applications.
We are therefore incentivized to develop a better understanding of data scientists' daily tasks (data exploration, modeling, and deployment of useful algorithms across organizations) and where the frictions occurs that causes relevant analytics to not be delivered smoothly in production.
Some years ago, industry leaders with input from more than 200 data mining users, data mining tools, and data mining service providers tried to model best practices to realize better, faster results from their data.
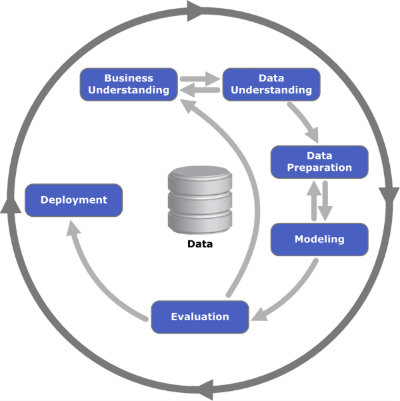
They came up with a methodology known as CRISP-DM, the Cross Industry Standard Process for Data Mining, an industry-, tool-, and application-neutral model. The method divides tasks into two phases: an experimental phase and a deployment phase.

CRISP Methodology for Data Science
The above diagram of a whirlpool explains how the CRISP phases work in harmony. There are two overlapping paths, and data intersects the center of both. The inner crescent moon loop in the center on the right side of the data reflects the experimental phase during which analysts are thinking about and modeling various hypotheses. The arrows leading to deployment stand for the process during which satisfactory experiments and models are deployed for production. The loop outside creating the entire moon represents the overall process, where analysts and individuals dealing with data start this process of experimenting and deploying over and over again.
Interestingly, even though CRISP-DM as a method was developed in 1996, there were no tools that managed to design something consistent with the core concepts of this methodology. Most tools on the market for data tended to not separate the experiment phase and the deployment phase.
Specifically, two different concepts are often mixed: a workflow and data pipeline.
A workflow is how a human maps his own work and thought processes to some abstract forms of labor on the data. For example, a person could think that she needs to clean the data, and then check the distributions of various aspects of the data with some graphs, before deciding on some statistical tests. She then writes some rough drafts of code to further think about her process and check her thoughts for further ideas. This is the experiment level within the CRISP-DM methodology.
A data pipeline is very much like an ETL (Extract, Transform, and Load) mainly composed of data transformations and their related dependencies (data A is stats_x based on data B & C). These data transformations can be static or generated code (such as models in machine learning). This is the deployment level.
The mixing of these two concepts is what causes the intermixing of deployment and experiment phases. Experiments very often pollute the final data pipeline with unnecessary nodes along the iteration process. This causes difficulties.
It is hard to follow a data project (what has been validated? what is currently under progress?), leading to difficulties when working collaboratively on the same data project.
What is the delivered product of a data analysis which is unclear? (Is it some charts on scoring? Is it the associated workflow that produces that chart? Is it the replayable sub pipeline of the entire data pipeline?) At a higher level, this causes people who are not hands-on with the data to not be involved at all stages of the experiment validation process because they are only given reports that stand out of the given data science tool.
Because of this, the pace of iterations (sequences of experiments that fail and others that succeed) is drastically slowed down.
Dataiku DSS aims to solve these issues by clearly separating the experiment tasks and the deployment tasks into different locations within the same tool.
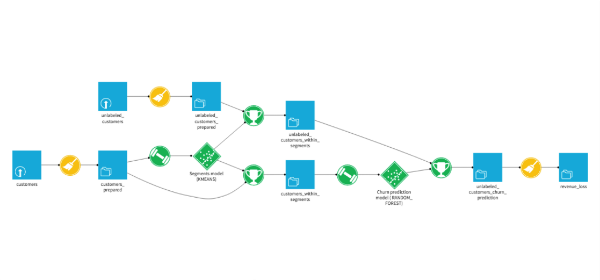
In Dataiku DSS, successful experiment are deployed in the flow. This is a data pipeline which looks like the diagram below:

Data Flow in Dataiku DSS
Each node in the flow contains a transformation (created by code or with visual tools) or a model that has been validated during dedicated prior experiments. The flow can be replayed thanks to our smart running engine that optimizes data load and processing. Models in the flow can be retrained and all their versions are kept so that the user decides which one is the best for scoring. In other words, the flow is always ready for production.
Where Are the Experiments Performed in Dataiku DSS?
For code lovers, experiments may be done within interactive notebooks (Python, R, SQL) in a comfortable drafting. Satisfactory code is then included in a node in the flow.
For non-coders, experiments are performed in a purely visual notebook called the analysis module where common tasks on the data can be taken on:
- assessing the quality of the raw data
- cleansing and visualization
- creating new features & modeling
- assessing the ML model and visualizing the predictions
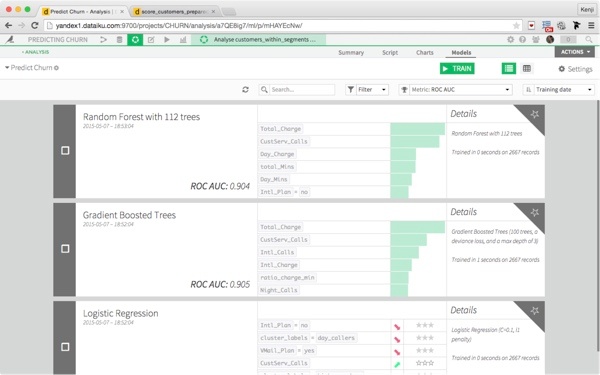
The analysis module provides more than 60 built-in, highly customizable processes to apply onto data. It also includes 15 different chart types. Machine learning options are very rich, including a powerful feature engineering, easy and customizable cross validation and hyperparameter optimization, various objective metrics, threshold optimization, and built-in charts dedicated for assessing models.

Machine Learning in Dataiku DSS
Even though this tool sounds complicated, it has been designed for beginners as well as advanced users in the very early stages of thinking about their data analysis experiments. It has in-place documentation and intuitive navigation in order to help everyone master the key concepts of data science.

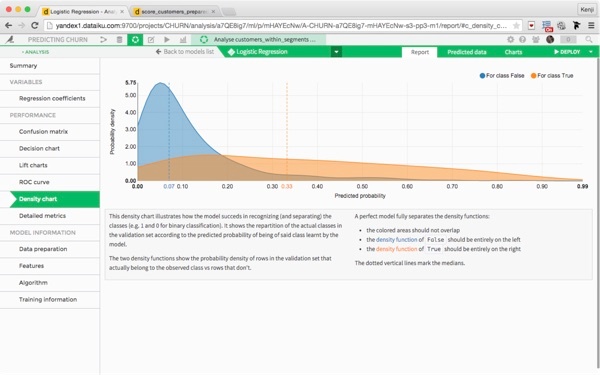
Model Analysis in Dataiku DSS
Advanced data scientists who like to code may also use the Analysis module as a powerful starting point. They can then export a model in readable Python code that they can play with as they wish.
Now, when an experiment is satisfactory, a data scientist or an analyst delivers the relevant content to the flow. This can be a transformation on the original data, a model (to be retrained or not), a chart, or some code involving any of the above.
The CRISP-DM loop is closed and high iterations are now within reach for data teams!


