


Here’s a brief description of a Dataiku marketer's first Kaggle competition — and remember, this Dataiku marketer is me, and I'm no techie.
Some of you may already know that my very first interaction with the data world was the day I joined Dataiku and started the Dataiku DSS tutorials. As I don’t speak Python or R (yet), I'm still only using Dataiku DSS’s visual interface for my personal projects.
Three weeks ago, Dataiku announced the release of DSS V2. As you can imagine, the whole Dataiku team was super excited not only about the announcement but especially about using DSS V2. That's why on May 20, Kenji, Dataiku’s Product Manager, gave the sales and marketing team a demo and presentation of Dataiku's new look, new feel, and new functionalities. Within minutes of Kenji finishing his presentation, we decided to start testing DSS V2 for ourselves. And what better way to test a data science tool than by competing in a Kaggle competition? That's when we started the West Nile Kaggle challenge — for which the goal is to predict West Nile virus mosquitos in the city of Chicago.
 I really didn't want to start my article with a picture of a mosquito because, well, everyone hates mosquitoes. So here's a gif of a scarred kitten instead.
Playing With Dataiku DSS
Gathered in a conference room, in a pleasantly competitive atmosphere, we began playing with Dataiku DSS. I insist on the word playing because it really did feel like a game.
At first, I was a little scared. I had datasets, I had Dataiku DSS. Okay, but I had to figure out what to do next. I already knew I wasn't competing for the top rank but I didn’t want to be the dumb kid in class either. I carefully read the Kaggle indications, studied the datasets, and decided to go about it one step at a time. So here’s a brief description of a Dataiku marketer's first Kaggle competition - and remember, this Dataiku marketer is me, and I'm no tech expert.
Step 1: Cleaning and Enriching
With Dataiku DSS, it was really easy to import the datasets and immediately start cleaning the data without a single line of code. The challenge offered multiple datasets but, for my first submission, I decided to use two datasets:
- The first one was the "spray dataset" which represents the areas that were sprayed in order to kill the mosquitoes and to eradicate the virus. I parsed the dates as suggested by Dataiku DSS. Then, thanks to a Dataiku DSS processor that creates a geo-point from latitude and longitude, I created a geo-point column.
- The second dataset was the "train dataset," which is also the main dataset: it shows the areas (with latitude and longitude) where the city of Chicago placed traps and how many mosquitos were found in each trap. In this dataset, I duplicated some of the same preparation steps (parsed the date and created a geo-point) that I’d used in the spray dataset. Finally, thanks to a suggestion by Marc, our CCO, I aggregated the lines that were "duplicated" when more than 50 mosquitos where found in a trap.
Thanks to the geo-point column I’d created in both datasets, I used the Dataiku DSS join recipe to join the spray and train datasets.
Step 2: Building a Model and Submitting a Prediction
Kurt, businessman by day and geek by night, proceeded to give me another helpful tip: retrieve and remove unused columns from the test dataset. I therefore decided to remove the addresses column because it wasn't in the dataset I used to train the model and because a model cannot be applied to information it has never been trained on.
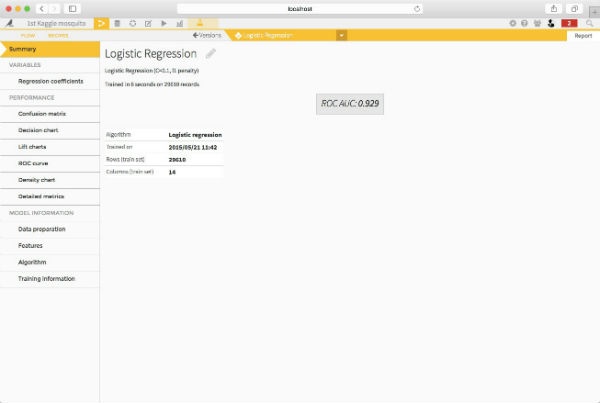
Dataiku DSS offers multiple options to build models and includes algorithms from the open source library scikit-learn. After testing a few algorithms including logistic regression, I noticed that the AUC was higher with random forest. Therefore, I chose to use a random forest model in order to predict the appearance of the Nile virus. I trained the model on the new dataset (result of the join and spray dataset I had previously cleaned).
Then, I proceeded to parse dates and to create a geo-point column on the test dataset. Finally, I applied the model on the new test dataset and submitted my prediction.
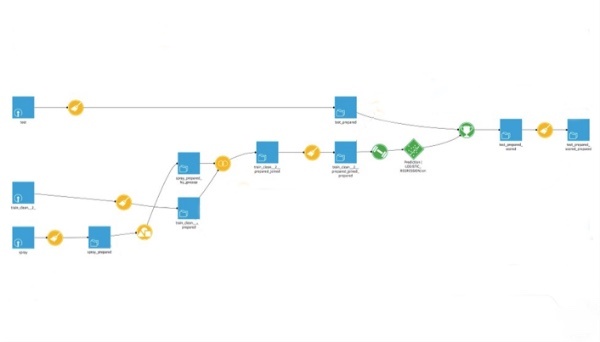
The final workflow looked like this:
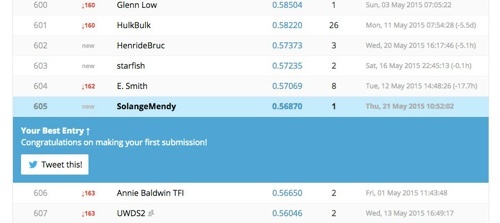
And here is my rank, for a first submission I’m not top ranked as expected but I’m not the lowest ranked either. Not going to lie: I’m proud of myself!
What’s Next
If you want to go further, I definitely suggest you read this blog post by Henri, a Dataiku data scientist, who ranked 60th for his first submission (out of 411 teams).