Intrigued by the feature engineering process, I decided to participate in Facebook's fourth Kaggle recruiting competition with the goal of predicting whether a bidder is human or robot based on its history of bids on an online auction platform. If you are new to Kaggle competitions, read how to get started with Kaggle.
The administrators gave participants three datasets: one train dataset containing bidder IDs and the target (human or robot), another consisting in the corresponding test set that was to be scored, and a third containing 7.6 million bids on different auctions.
Something I really enjoyed was how one had to create one's own features in order to compete. For me, feature engineering is the funnest part of a modelling project because it depends on creativity. It was not like the OTTO challenge, in which all the columns of the dataset were anonymised and the only way to improve the model performance was to optimize the machine learning part.
That is why I recognized two challenges in this competition: feature engineering and model optimisation. In this post, I focus only on the feature engineering part.
In many ways, feature design for bot detection is very similar to what needs to be done for fraud detection. Many of the ideas for features I created come from my experience in this field. After all, to create smart features, you have to put yourself in the bot designer / fraudster's shoes. And that's exactly what I do when I'm working on these types of projects.
We were given this kind of data:
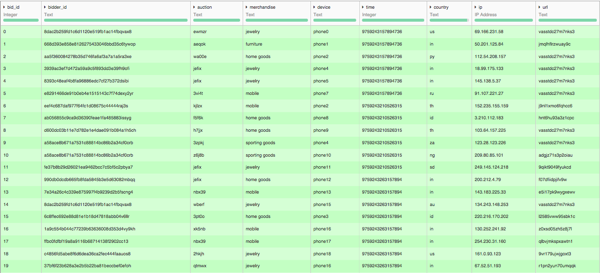
The bidder_id is a unique identifier that we will have to score. We were provided information on the auction (auction is the identifier and merchandise the category of product sold), on the conditions of the bid (device, country of IP address, anonymised IP, referer URL), and an anonymized time. Note that there is no price information. This is because each bid adds the exact same amount of money every time.
So what could distinguish a human from a robot? Here is the list of the features I decided to use.
Obvious Features
My first intuition was that, from a physical point of view, a robot is able to take part in more auctions than a human. Hence, the first feature is simply the total number of auctions.
The second intuition is that a human will use only a small number of devices and IP addresses whereas a robot can use many more. So I created features on the number of distinct devices, country, IP and URL used by a bidder. I also used counts on combinations of these.
For example, total number of (device, IP) per bidder. This intuition can be confirmed by looking at the data. Here is an example of a bot in the data (bids sorted by ascending time).
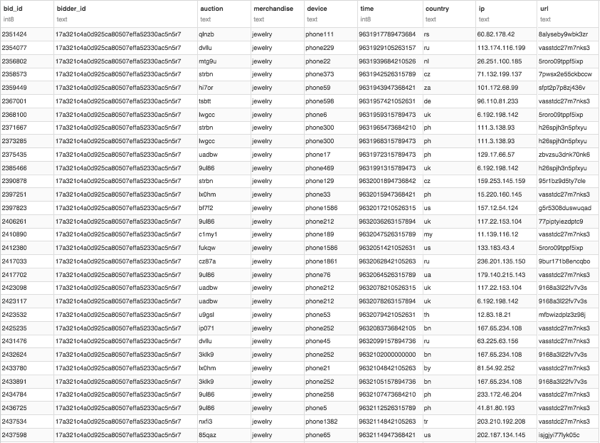
The problem with counts is that they increase with global use so we need to rescale them. One way to do this: counts per auction and then calculate quantiles / aggregates for each bidder. Example: min, max or mean of number of device per auction. An other way to do this would be to rescale by time. But, because time was obfuscated, this approach was more complicated.
Other features could be the main country used and the main merchandise bought.
Who cares about time obfuscation?
There was a big discussion on the forum about time obfuscation. I chose to play without trying to break it because the information on time order is already important.
To understand why, we once again need to think like a robot designer. What would be the goal of a robot? How and why would a robot enter an auction? Well, I see two main reasons (apart from trolling) to have a bidding robot.
- To win the auction
- To make the price artificially higher
Logically in this case, winning the auction corresponds to the last bidder, information that I easily retrieved. On the other hand, if I wanted to raise the price I would not win, but I would probably finish second, bid on myself several times, or make a new bid every time someone bids.
I also had the intuition that a robot would be more likely to be the first to bid on an auction or to bid after the first person has entered. So all this boils down to the following features:
- % of time first, second, before-last, and last in auction
- Percentage of bids on one's self
- Percentage of bids when an other bid was done
It seems that I was right:
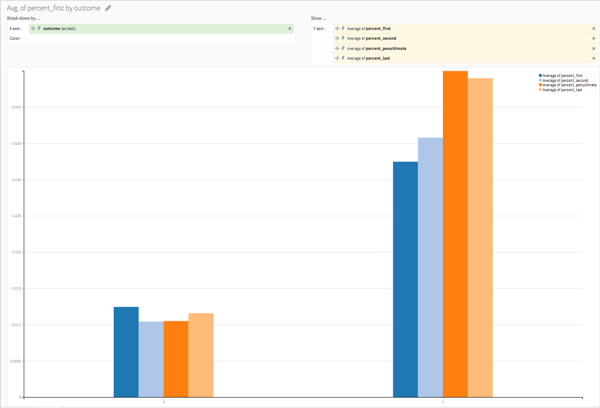
On average, humans (coded by 0) are way less likely than bots to start an auction or to finish one (rescaled by the number of auctions they entered). In the same way, if we look at the percentage of bids of a bidder that are bids on him or herself (and the percentage of bids that are auto bids and have a change in IP, URL, or device) we get the following graph:
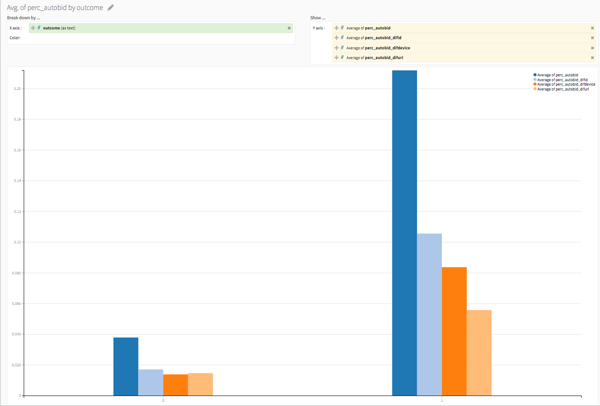
We can also create features similar to counts of distinct devices, IP, etc. It is possible for a human to have several IPs if he is travelling but he may use one for several auctions and then another one, etc. He will probably not be changing for every bid. So a feature could be the number / percent of times there is a change in the IP.
But we can go even further. To help me create features every time I ran a model, I used the prediction on a hold out to understand what was not well predicted. I wanted to understand how and why a human bidder could have a high probability to be predicted as a bot. Here's an example.
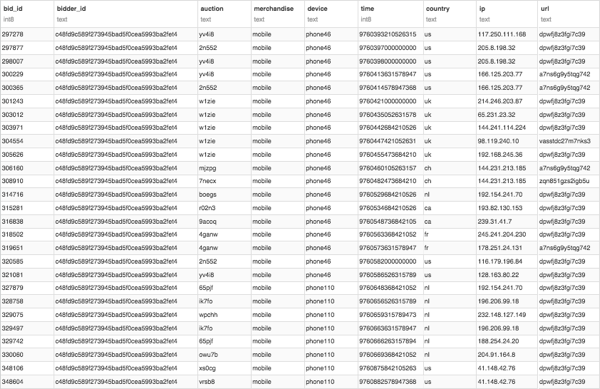
If you look at the auction, it is less random than if a bot was to bid on everything at the same time. It seems to look more like a,a,b,a,b,b,c,c then a,c,b,b,a,b,c,a, meaning that the first auction seen in the list seems to finish way before the last one seen.
As a result, I did the following:
-
Give a rank to each auction from 1 to K based on the starting time (or finishing time) for the user.
-
Get the entire sequence of auctions for the user (ex: 1,2,1,1,1,2,3,3,2,3,4,4).
-
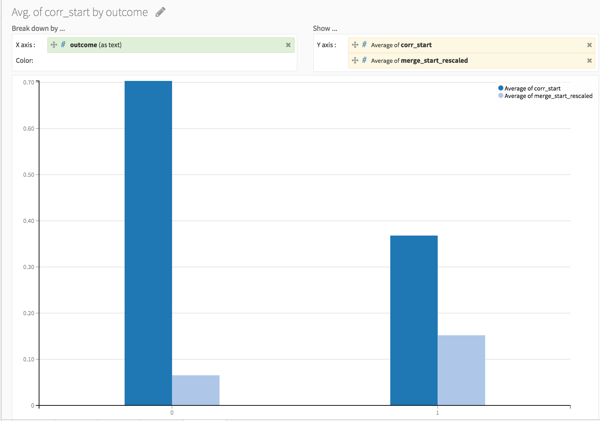
Compare this sequence with the ordered one via the correlation between the two vectors or by counting the number of inversions needed to sort the sequence via merge sort (ok, ok, I'm slightly proud of this one). This is interesting because a high correlation (or low merge inversion value) is more likely for humans since they are not able to do pure random bids. This can be verified on the graph below.
Following the same idea, it is also possible to compute the number of active auctions at any time for a user (number of auction for which there is still an action later) and to derive quantiles of this measure.
Finally we can create features on the time variable itself, for example the number of times a bidder made several bids at the same time. Now if we had the hypothesis that inside an auction the difference between two times is proportional to the real difference (which corresponds to the obfuscated time to be a linear function of the real time), then we can add more features. As a bot could be timed to make a bid every X seconds, we can check if there is a mode in the difference distribution.
So in the end, simply having the information of time order enables us to create numerous interesting features.
Graph features
In fraud detection it is common to use graph features. Indeed since fraudsters are often organised in networks and are using the same information multiple times (ip, e-mail, account, physical address), propagating the fraud information in the network can be useful. More information can be found about this neo4j pdf.
I tried to create similar features for this bot detection problem. I used four graphs constructed with the IP, URL, device and auction information. For each of these, I generated a graph by (example with IP):
- Counting the number of times a bidder uses the IP
- Setting a link between two bidders if they share the same IP with a weight
count(bidder_1)*count(bidder_2) - Generating only one edge between two bidders with weight being the sum of the weight in the previous graph
I first thought of getting the basic graph analytics features. I used the networkx python library to generate the weighted degree, pagerank, and clustering coefficients for each bidder. These features can add some information but it is easy to see that they are similar to the counts of distinct auctions, devices, IPs, and URLs. A higher degree is obviously correlated to these and a high clustering coefficient is correlated to the degree because all hubs are connected.
The second idea is to propagate the target in the network. Instinctively, if a device or IP is used by a bot and another bidder, the latter is likely to be bot. We could get this information by using IP as a categorical feature and dummify everything, but this would add too many columns for the small amount of lines we have. The other solution would be to use impact coding, but it may be too sensitive as some IPs may be used only by one bidder. Therefore, the model will overfit the impacted IP column and will not be very predictive on unseen IPs. The network impact should lead to less overfitting since we are not using the bidder target to create the feature. It could be seen as a "unimpacted impact coding".
At the end, I had more than 120 features and I was confident I had captured most of the information contained in the bids dataset. I tried to capture features on what a bot would be designed to do as well as how it would be implemented. I then used gradient boosting trees to generate the predictions and finished just after the top 10 %, probably because I overfitted the train set even though I used 10-fold cross validation.
I had a lot of fun "role playing" as a fraudster in order to design all of these features. I made most of them with SQL window functions on Dataiku Data Science Studio software! If you have any question on how to build one, contact me @prrgutierrez.


