Statistics can be tremendously beneficial for data scientists, both those that are new to the field and those who have been practicing for a number of years. In fact, a large portion of data scientists are former statisticians. Statistics, or the practice of using mathematics to analyze, interpret, and present data, allows us to leverage data — a critical element to any impactful machine learning model — in a deeper, more concrete way. While many data scientists do not have formal training in statistics, having a foundation of the basics can be critical. In this blog post, we will cover three basic statistics concepts that will come in handy for any data scientist.
1. Statistical Features
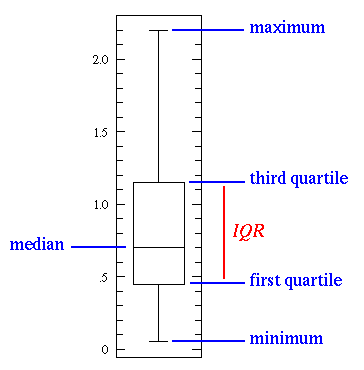
Statistical features, a popular statistics concept for data science, comes into play during the data exploration phase and includes topics such as bias, variance, mean, median, and percentiles. When looking at the basic box plot below, the minimum and maximum values represent the upper and lower ends of the data range. The “first quartile” is used to demonstrate that 25% of the data points fall below that value, while the “third quartile” shows that 75% of the data points fall below that value.
 Image source: Medium
The box plot can be used to effectively interpret findings about the data. For example, if the box plot is short, many of the data points will have similar values. When it’s tall, it can indicate that the data points are diverse, since the values are spread out over a wide range. If the median value is closer to the bottom than the top, we can determine that the data has lower values, whereas if it’s closer to the top, we know the data has higher values. If the median does not fall in the middle of the plot, this might be an indicator that the data is skewed and should be studied closer before being used in a model.
2. Probability Distributions
Probability refers to the likelihood that an event will randomly occur. In data science, this is typically quantified in the range of 0 to 1, where 0 means the event will not occur and 1 indicates certainty that it will. The higher an event’s probability, the higher the chances are of it actually occurring. Therefore, a probability distribution is a function which represents the likelihood of obtaining the possible values that a random variable can assume. They are used to indicate the likelihood of an event or outcome.
 Image source: Medium
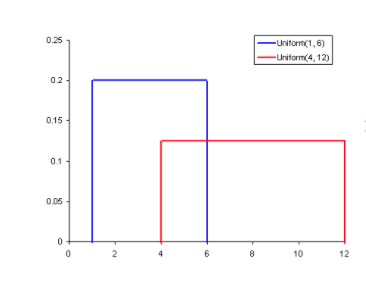
The image above illustrates the most basic probability distribution, a uniform distribution. This shows that all values between a given range are equally probable, while all others can never happen.
3. Dimensionality Reduction
When discussing the concept of dimensionality reduction in the realm of data science, data scientists take their dataset and attempt to reduce the number of dimensions it has — meaning, the number of feature variables. If we took a cube to represent a three-dimensional dataset with 1,000 data points and projected it onto a two-dimensional plane, we only see one face of the cube. This improves visualization, as it’s easier to see a graph in a two-dimensional space than in a three-dimensional one and, with machine learning algorithms, it takes less resources to learn in two-dimensional spaces than in a higher space.
Dimensionality reduction can also be performed through feature pruning, which helps remove features that will not be important in the ultimate analysis. After reviewing a dataset, for example, we may realize that of 20 features, 14 of them have a high correlation with the output but the other six have low correlation. It may make the most sense to remove them from the analysis at that stage without negatively impacting the output.
Final Thoughts
By familiarizing themselves with basic statistics concepts, including statistical analysis and probability, data scientists will be able to gain a competitive advantage. Given that a significant chunk of data science and machine learning projects are rooted in data analysis, knowing these concepts will enable data scientists to extract more powerful insights and make more informed decisions from their datasets.


