


When you walk around a city, you get a pretty good idea of how neighborhoods compare. You might start in a residential neighborhood and then walk to a busy area with lots of bars and restaurants before winding up in an office district. But what if you could get this insight into different neighborhoods without walking through — or even visiting — the city?

We’ve tried to answer this question in a Dataiku project that is live right now on our website for you to check out. The cities we’ve analyzed are New York and Paris, and we’d love to have you dive into the analysis and the results to see what you think about our geographic clusters.
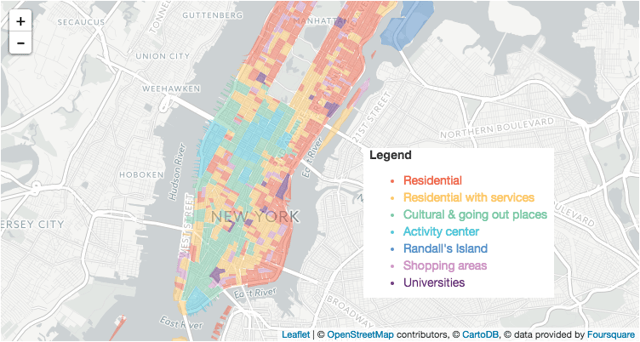
Each Manhattan city block is represented by the color of its cluster.
Our raw data comes from two main sources: Open Street Map (OSM) and Foursquare via their public API. From the OSM data, we pull in information about the streets and buildings, which we then merge with U.S. Census data (in the case of NYC) and the French government’s IRIS dataset (for Paris) in order to aggregate it. From Foursquare, we bring in check-in data for city locations, which are categorized as Food, Residential, Professional, etc. We then use Dataiku to prepare and join this data, and we use the K-Means clustering algorithm to create the clusters (seven in New York and five in Paris).
On the project page, each button marked “Explore!” brings you directly inside the project in an almost fully functional Dataiku interface so that you can see just how Dataiku works and how simple it is to set up this project. Make sure you check out the dashboards, as these are the key outputs of the project (and it's also where you can see how our clusters correspond to your familiarity with the cities).
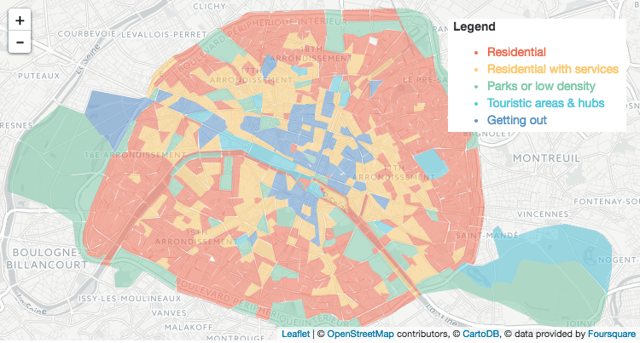 It's striking just how much of Paris is residential!
We’ve named the clusters, but whatever you call them, you can see the patterns that emerge across the maps. In New York, for example, almost all of Manhattan above 59th Street is residential or mixed-use, while from Midtown through Downtown is a corridor of office buildings, cultural institutions, and activity centers. In Paris, most of the active centers are on the Right Bank (the part of the city north of the river), with just a few heavily tourist and trafficked sections on the Left Bank in and around the Latin Quarter. Remember, these clusters were created by an algorithm, trained with publicly available data, with no guidance or massaging by us. Not bad, right?