


This blog post was created in collaboration with Andrea Castellani, Ph.D. researcher at Bielefeld University in the Machine Learning research group. Among his research topics, he has significant experience in using digital twins for anomaly detection.
Digital twins, often defined as "a digital replica of a real object or process," are high-fidelity simulation systems that incorporate real-world input data to provide a realistic simulation. This results in an almost perfect digital copy, the output of which can be directly compared to the real-world process. To learn more about digital twins, check out this article on the variety of digital twins.
Usually, a vast amount of data is available, but much of it is unlabeled. Labeling data demands considerable effort from human experts to manually create fully labeled datasets. Anomaly detection pertains to the challenge of identifying patterns in data that deviate from expected or normal behavior. Anomalies, being rare and unusual events by definition, make their detection difficult due to the data distribution being heavily skewed toward the normal class.
Leveraging digital twin systems, it is possible to generate a large dataset that contains data samples from both normal and anomalous conditions, which can then be utilized in machine learning (ML) approaches.

In this project, we demonstrate the potential of digital twins within the context of anomaly detection. Our example involves a digital twin model that is a Functional Mock-up Interface (FMI), a software modeling tool written in Modelica. Specifically, we showcase a scenario where a bouncing ball interacts with different surfaces, some of which are defective. Our objective is to detect and identify these anomalous surfaces. By employing the physical representation of the bouncing ball as an FMI, we can simulate the dynamics of the process under various initial conditions.
This article presents a digital twin-based approach for anomaly detection tasks, guiding you to create a dataset with normal and anomalous samples to boost ML performance. Our work has diverse real-world applications, such as minimizing recalls and improving product quality in manufacturing or preventing equipment failures in the energy sector. By the end, you'll have a hands-on method to harness digital twin technology for anomaly detection, unlocking its potential for various data science and ML tasks using Dataiku.
How Does Dataiku Manage Digital Twins?
With Dataiku, it is possible to easily integrate a digital twin model in any ML task. The showcase of this work is applied to anomaly detection. We target the case when real measurement data is only partially labeled, some anomalous cases have been labeled, but then the normal class data is unreliable.
Anomalies can come from many different factors and casualties, hence it is not easy to simulate and cover all the anomalous cases. The idea is to use the digital twin to artificially generate, with a high precision level, a large amount of data reflecting the normal class. This simulated data will be integrated into the available real-world data, to enrich the training dataset.
The overall project in Dataiku, depicted in Figure 1, can be represented as a modular structure:
- Blue zone: Digital Twin (FMI) model simulation and simulation data creation.
- Green zone: Loading and preprocessing of real measurement data.
- Purple zone: Merging real and simulation data and train-test split.
- Red zone: Training and evaluating the model only with real-world data.
- Yellow zone: Training and evaluating the model with digital twin data.
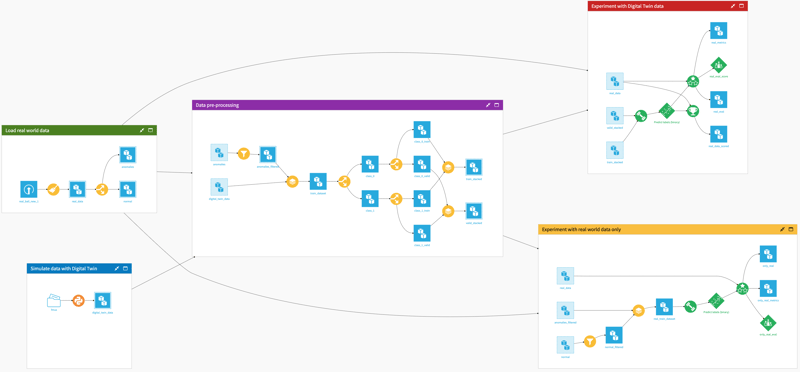
Fig. 1: Project layout in Dataiku.
The main part relies on the blue zone, where the digital twin, the FMI model, is simulated. The FMI can be simulated by the Python open source library FMPy. To do so, we used Dataiku-integrated Jupyter notebooks. Its core part is shown in Figure 2.
After loading the necessary dependencies, the selected FMI model (“bouncingBall”) is defined and read from its folder. We ensure the model is properly loaded by printing its description in the cell [7]. Furthermore, in the cell [8], the different ranges for the free parameters are created. In our use cases, they are the initial altitude of the ball (h) and the relative bouncing index of the surface (e). After that, in the cell [9] the model is simulated with all the combinations of initial conditions of the free parameters. Finally, the simulated data is merged in a single data frame and set as the notebook output.
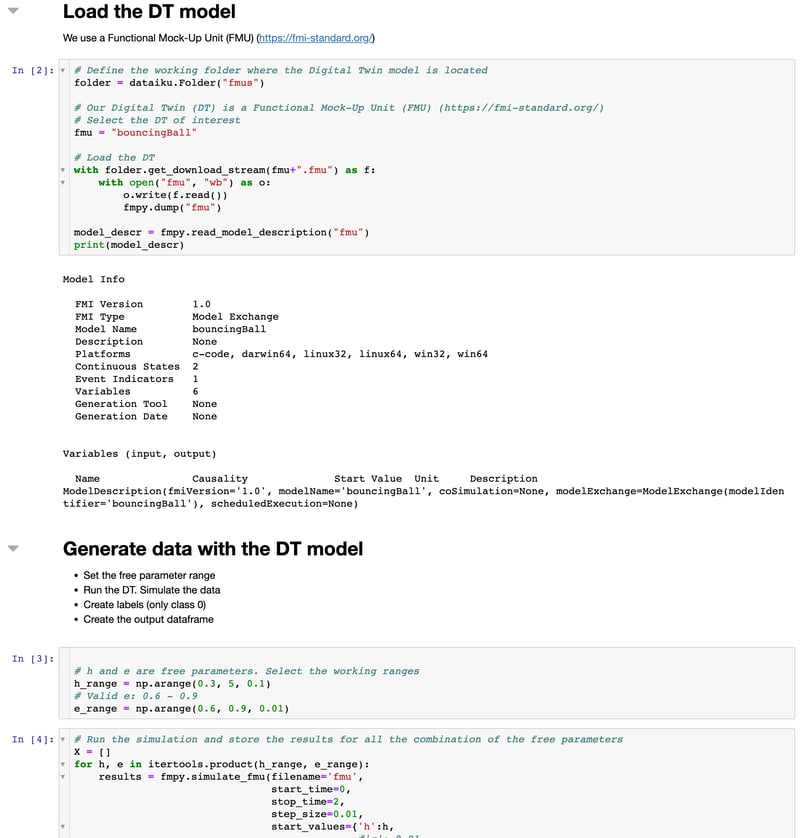
Fig. 2: Python notebook to simulate data with the digital twin model.
Splitting the dataset into training and testing parts is pretty standard when working on ML models. In our case, when we mix real data with digital twin simulations, we end up with a super unbalanced dataset. So, when dividing it into training, validation, and testing, we needed to watch out for class distributions to avoid any sneaky bias in our model.
To tackle this, we use stratified splitting for these datasets, ensuring the training and testing parts have the same percentage of target classes as the original dataset. This splitting strategy is implemented in Dataiku with the purple block as depicted in Figure 3, using a combination of visual split and stack recipes. For example, if we had 10% positive cases in the original dataset, we'd keep the same 10% in the training and testing sets. It's a must-do, especially when dealing with small, unbalanced datasets.
We trained several models using Dataiku AutoML features. After some experimentation, we picked the random forest model. This approach helped us get the most out of ML and build a solid solution for spotting anomalies more accurately and efficiently.
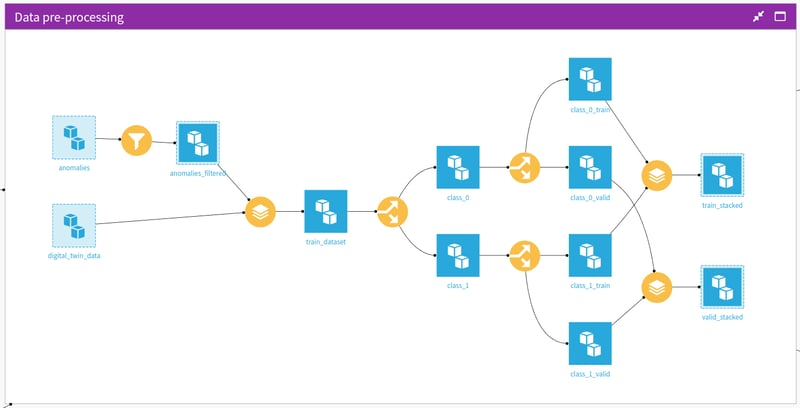
Fig. 3 Data preprocessing and stratified train-test-split.
Experiments and Results
To empirically prove the benefit of augmenting the train data with a digital twin, we trained two different models: one with only real measurement data and another with the augmented training set. For fairness, we compare the performance of the two models on the same holdout test set, their results reported in Figure 4, respectively left and right.
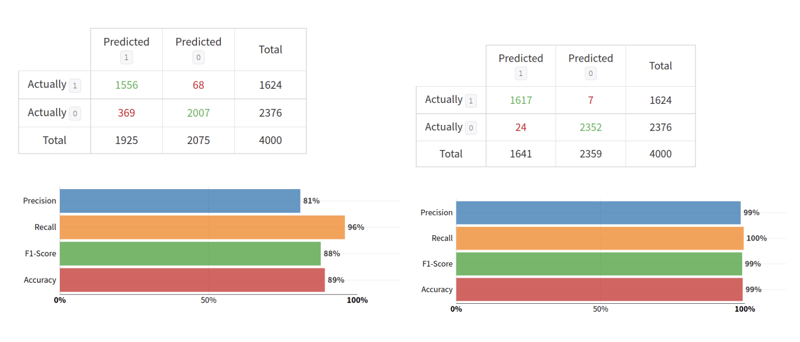
Fig. 4: Confusion matrices of different models tested on the same test set. Left side, the model was trained with real measurement data only. Right side, the model is also trained with digital twin data.
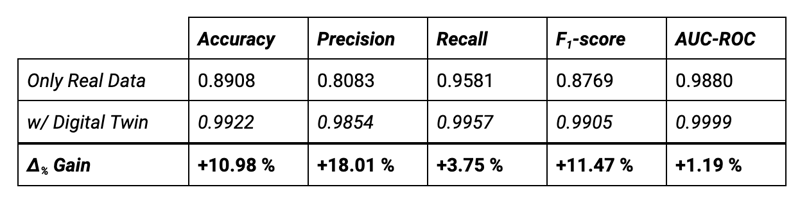
Tab. 1: Experimental results on the test set.
Through analysis of the confusion matrices, it is possible to calculate the common classification metrics Accuracy, Precision, Recall and F1-score, which is defined as the harmonic mean between Precision and Recall. The F1-score is particularly useful when dealing with imbalanced datasets, as it provides a better overall insight into model performance. The results of our analysis are reported in Table 1.
Our primary goal is to accurately detect anomalies while minimizing false alarms, and with the help of the digital twin, this is significantly improved.
By using the digital twin to enhance the training data all the metrics are improved, up to 18%. The recall metric, which measures how many positive class samples are correctly identified, is improved by only 3.75%, while the precision is by 18%.
This is because, with the help of digital twin data, the model significantly reduces the error rate of the positive (anomaly) class; the number of false positives drops from 369 to just 24 samples. Additionally, the false negative predictions are cut from 68 to merely seven samples.
The model is also not only more accurate but also less biased towards the majority class. The AUC-ROC metric calculates the Area Under the Receiver Operating Characteristic curve. The ROC is created by plotting the True Positive Rate (recall) against the False Positive Rate (false alarms) at various threshold settings.
The curve for the two models in our analysis is depicted in Figure 5. It is clear to see how beneficial is the use of the digital twin for low false positive rates.
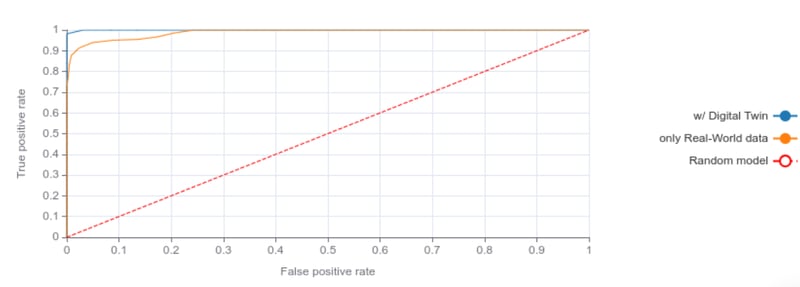
Fig. 5: Receiver Operating Curve (ROC) on the test set with model trained with only real world data (orange) and with also digital twin data (blue).
Putting It All Together: Enhanced ML With Digital Twins
In this article, we have provided a hands-on guide on integrating digital twin models with Dataiku. We tackle anomaly detection in cases where available measurement data is partly labeled. Our focus was on showcasing how digital twins can be used to augment the available dataset by generating data that reflects normal process operations.
We have realized the whole project in Dataiku, the digital twin is implemented as a Functional Mock up Unit (FMU), which is integrated into Dataiku with a Python notebook. The anomaly detection problem is formulated as a binary classification, and we used a random forest as a model. Our experiments have empirically proven that using a digital twin can significantly enhance the model's performance. Both the false positive and negative error rates of the model are greatly reduced, and the F1-score on the held-out test set improves by 11.47%.
A further step would be the integration in Dataiku of one-class methods which are better suited for anomaly detection, or the usage of deep neural networks. To know more about applying digital twins models to neural networks, check out the research article: Real-World Anomaly Detection by Using Digital Twin Systems and Weakly Supervised Learning.